

In Production, the only kind of data that matters is real-time data. The latest release in Instrumental MP is Control Panel, which puts real-time yield and defect trend data at your fingertips. Specifically designed for high volume or mission-critical production environments, Control Panel aggregates failures from all Instrumental Stations, intelligently ranks trends based on severity, and displays actionable data at decision-making resolution.
By surfacing critical defects from the factory floor in real time, Control Panel’s intelligent dashboard gives your team yield control unlike anything they have ever had before. Use Control Panel to identify and catch quality shifts in real-time, drill down from the trends to understand the underlying defect data, and export charts and reports for rapid and clear communication across internal and external teams.
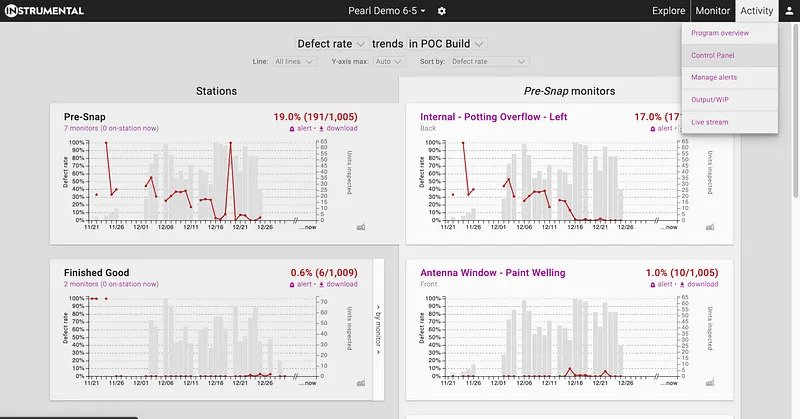
Access Control Panel in the Activity tab
Any Instrumental user can access the Control Panel feature in the Activity tab located at the top right of the navigation bar.

Control Panel leverages real-time data and sheds light on core metrics
Control Panel can show real-time rates for in-factory Intercepted defects (only) or all defects found across all tests in a particular build or date range. The left column shows the overall failure rate for each station. The right column shows the corresponding failure rates for the selected station. Instrumental uses algorithms to sort the tests that are the dominant drivers of the defect rates at the top. This high level view makes it easy to see at-a-glance which defects are driving yield loss.
Adjust Control Panel for your unique questions
Whether you want to check the pulse of the factory or find the biggest yield hitters, Control Panel can be adjusted using the filters at the top to fit your needs. Depending on your interest, you can inspect by assembly line, adjust the Y-axis so you can zoom in on items with lower failure rates, and change the display order of the charts.
Drill down to root cause in a matter of clicks
Control Panel is a highly tactical dashboard. Once you identify a shift in defect rate on the Control Panel, you can uncover the root cause by clicking a data point or highlighting a timespan on any chart. The charts on the right will update to show images of passing and failing units from the selected time period. If you need more context, you can click those images to dive deeply into the data to support your corrective action plans.
Export charts to streamline presentations and team communication
Instrumental provides data at decision-making resolution so that your team can take fast, informed actions. Many teams have a high reporting burden – building presentations to keep everyone on the larger team informed. Download a presentation-ready version of the chart to accelerate your reporting and updates.
Author
Related Topics