


Key takeaways:
- Identify defective regions on each unit immediately instead of scouring the entire surface area within a photo (or manually on the line).
- Easily compare defects across photos and investigate both known and automatically discovered issues on the same screen.
- Combine the new heatmaps with parametric data filters to determine correlations and root causes.
Conducting failure analysis can be the most difficult and time consuming part of a mechanical or design engineer’s day-to-day. Instrumental has taken another step forward in accelerating that process by incorporating our proprietary anomaly Heatmaps in the Explore view for easy access and lightning-fast unit-to-unit comparisons.
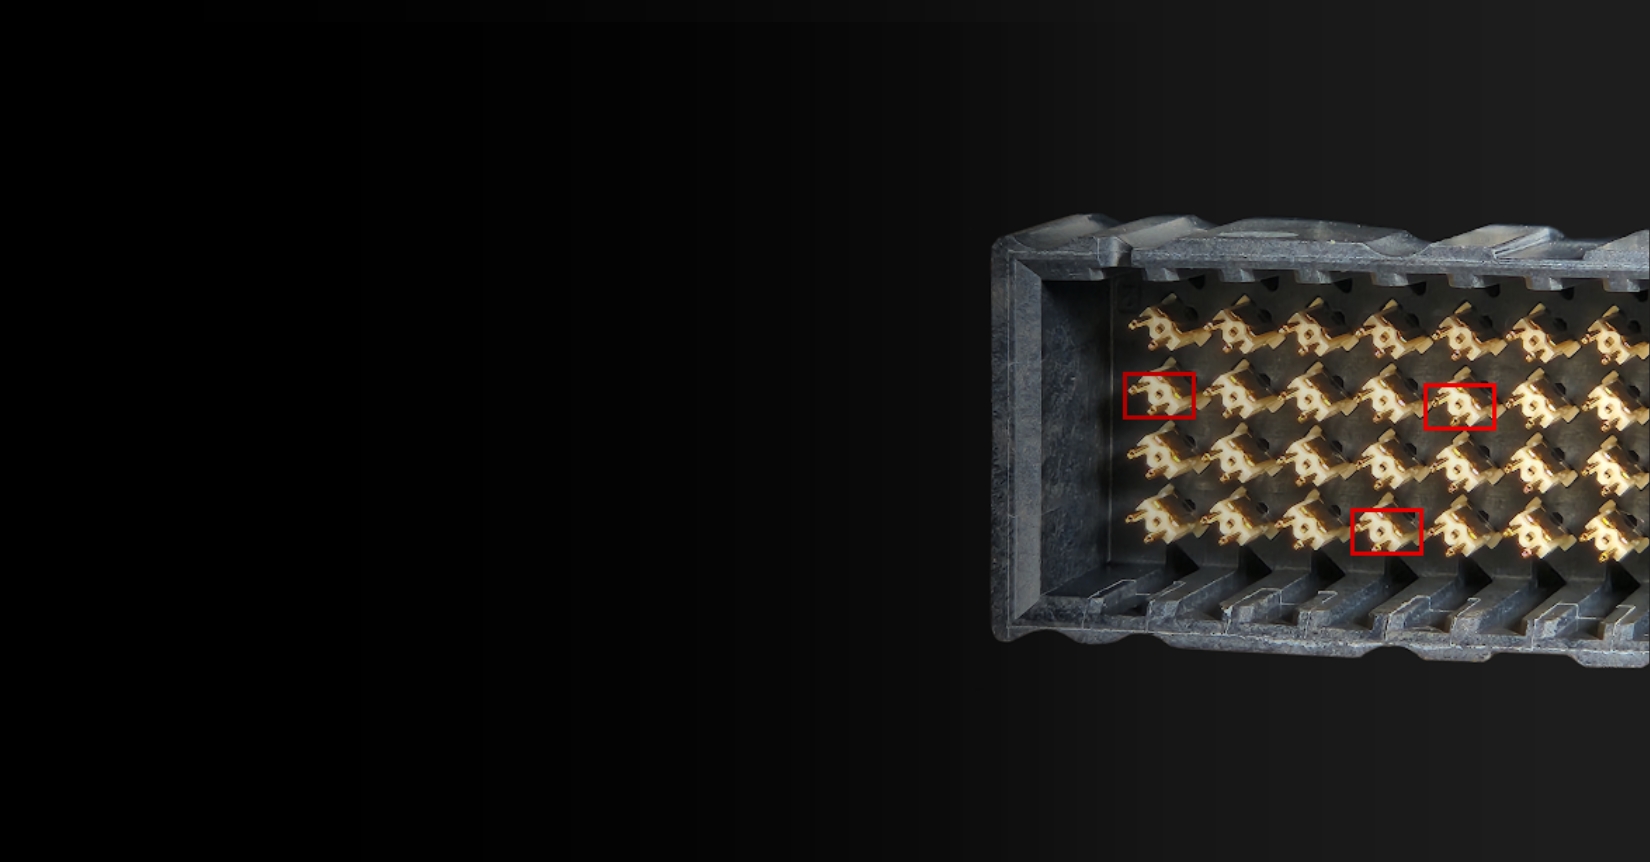
Heatmaps in Explore are overlays on the selected main image of a unit highlighting both anomalies proactively identified by Discover AI and issues reactively tracked by Monitors. The regions and their colors indicate Instrumental’s predictions about the anomalousness of the current unit/photo in each region compared to hundreds or thousands of others.
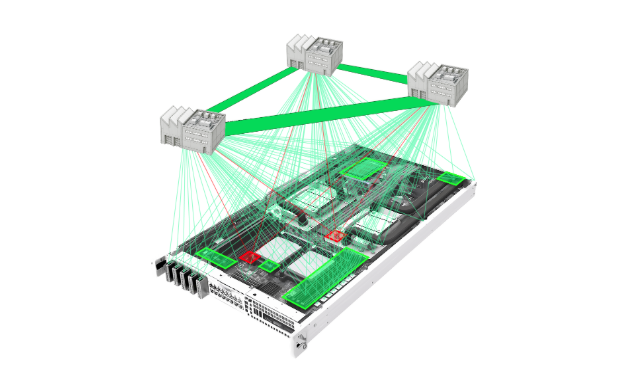
For those unfamiliar with Instrumental, Explore is a tool which allows product engineers to investigate variation in a component or process, identify and investigate defects, and introduce solutions which can be measured by real-time alerts.
Your central hub for failure analysis
Traditionally, a product design engineer would need to manually examine a physical unit to investigate the kinds of defects Instrumental can discover. Previously, engineers doing FA on a particular unit would typically use Instrumental to examine each entire photo of that unit in detail looking for potential defects. With Heatmaps in Explore, potentially defective regions are immediately highlighted, so engineers do not need to spend time investigating other areas and can quickly identify potential problems to dig into.
Now, both known and unknown issues which Instrumental is scanning for are visualized in the same screen so you never have to worry about missing potential issues. This makes FA easier and faster because users such as mechanical engineers can quickly identify potential issues and skip conducting individual searches with Instrumental’s Detect AI.
For higher level understanding of a program’s status and issues, Instrumental provides additional views for the known (“monitored”) issues, automatically “discovered” issues, and overall yield, along with alerting options to ensure problems are intercepted before they escalate.
Driving root cause correlations with heatmaps
When filtering to a specific set of units, such as those that failed a functional test, flipping through photos of those units and seeing the heatmaps change makes it clear where issues may be common/correlated among the units that failed the test.
For example, a user might search for “Front Camera Test value = FAIL,” revealing photos of their product’s front camera on failing units. Flipping through these photos to see what Heatmaps in Explore highlights – for example, scratches on the camera – takes seconds. The heatmaps also highlight other issues on the units, potentially revealing components with correlated defects that could provide clues to the root cause of the functional test failure.
FAQs | Heatmaps in Explore
What do the different colors on the heatmaps mean?
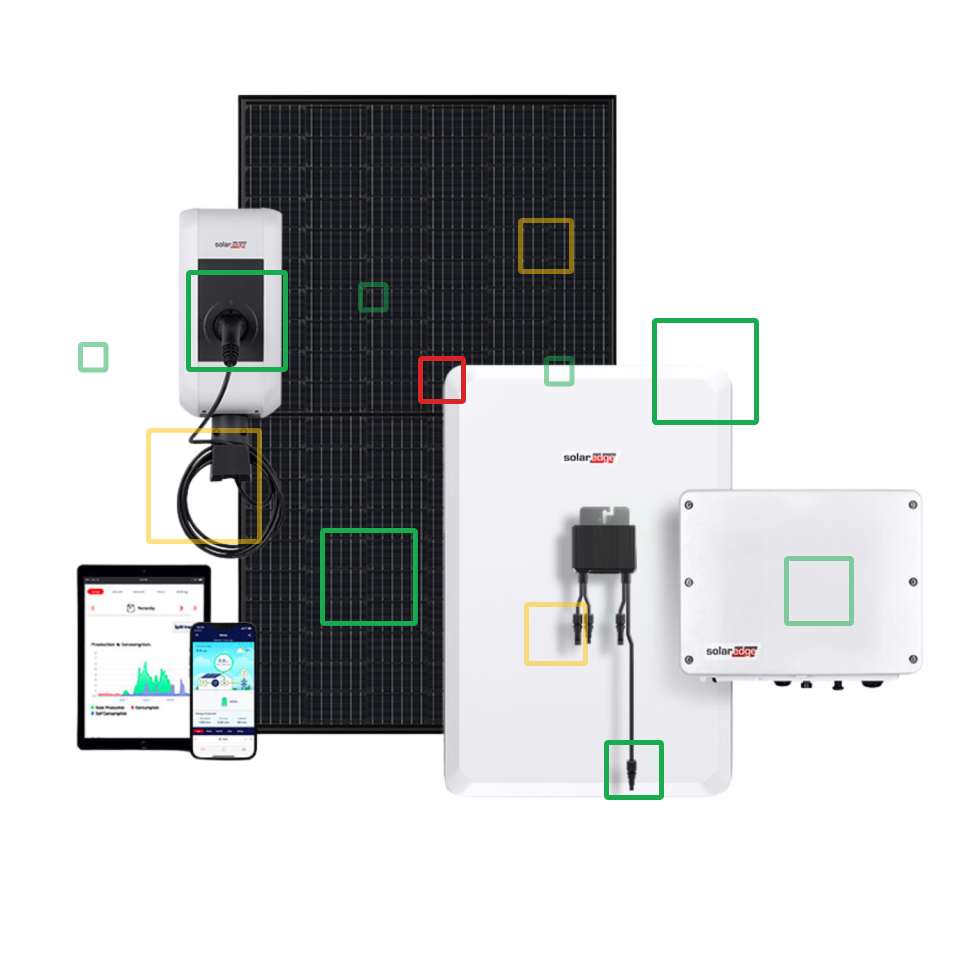
- Failures intercepted on-station are dark red with a solid purple border
- Failures predicted by a cloud monitor are red with a solid red border
- Discoveries are orange with a dashed orange border if the current photo is among its top 5 most anomalous
- Discoveries are yellow with a dashed yellow border if the current photo is among its top 6-10 most anomalous
- If the current photo is not among the top 10 anomalies in a discovered region, or if a monitored region predicted that the current photo is passing, the region is not shown by default; toggling on “passing” regions reveals these as transparent boxes with a gray-green border
How do I see more details about a region / other units with a similar issue?
Clicking on a region reveals a tooltip with a link to the monitor or discovery that the region represents, where you can find more photos of other similar units and compare them in that region. The photo you were looking at before clicking through the region will be highlighted for easy reference.
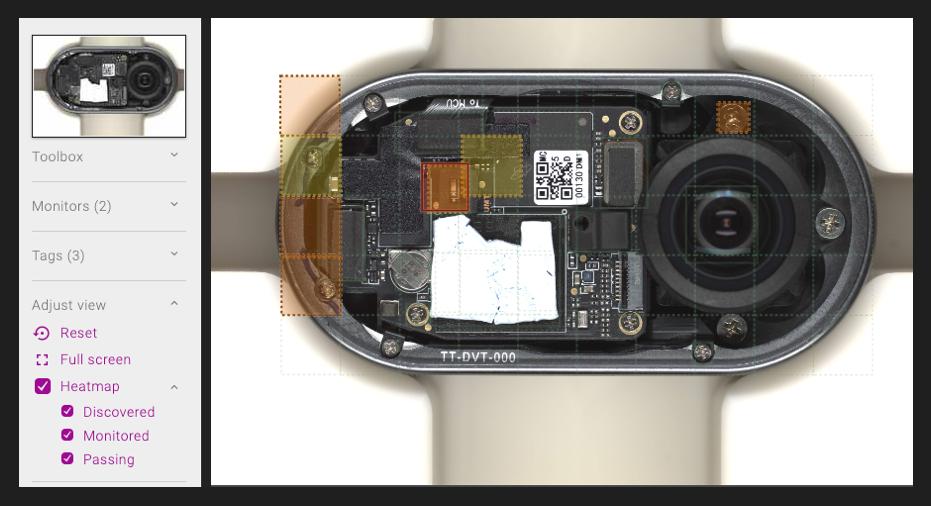
Can I toggle the heatmap’s visibility?
Yes, there is a toggle button in the sidebar. You can click the arrow next to it to expand additional options to separately toggle monitored regions, discovered regions, and passing regions. Your selections will be reflected in the URL so that if you share the link, the heatmap visibility you pick will be preserved. (“Passing” regions include monitored regions where the photo was not marked as a failure as well as discovered regions where the photo did not rank among the top anomalies.)
Protip: the M key is a shortcut for toggling the heatmap’s visibility.
To learn how Instrumental’s new features can help your engineering team, schedule a personalized demo today.
Author
Related Topics