

Support / How do I find and fix a defect based on component or region of interest?
You can use Instrumental to quickly explore anomalies in a component, identify and isolate defect mode(s), investigate to find a root cause, and then drive and monitor corrective actions to fix the issue.
This article explains how to use Instrumental to accelerate issue analysis. For illustration, we’ll use an example of a mic test failure.
Table of Contents
Start on the Units page
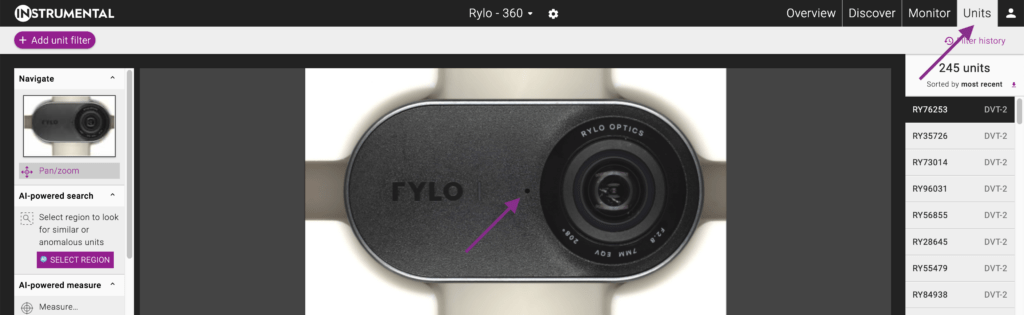
Let’s say you’re alerted by your factory team that there are failures in mic testing. In this case we’ll start on an image with the microphone port.
Explore variation in a component or process
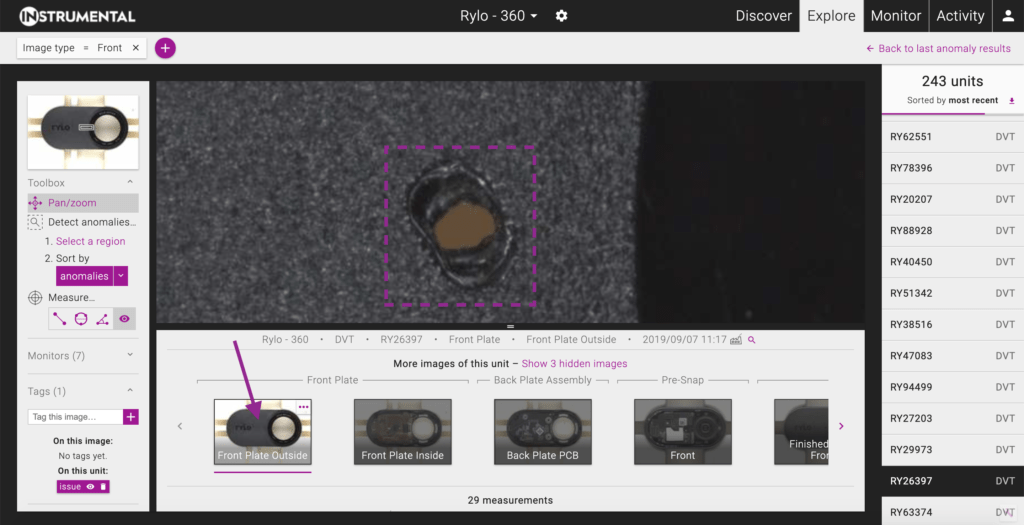
Zoom in on the component or area of interest, in this case the mic port. In some cases, you may see a heatmap of regions overlaid on the photo. These indicate if Instrumental has automatically discovered an issue or if a user has already created a monitor for it. Clicking on a region will show the name of the region, which you can click on to see the monitor or discovery and other units that were flagged.

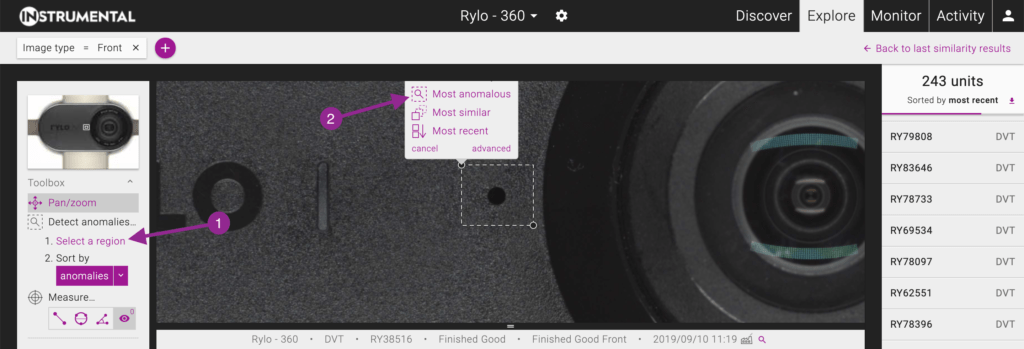
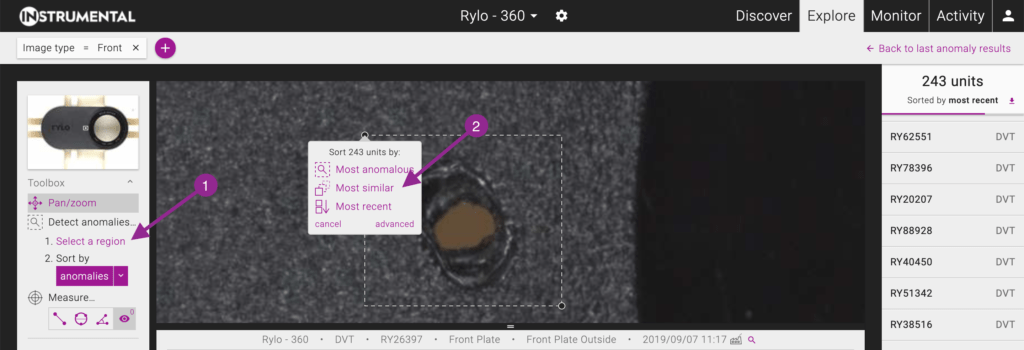
If the region is not already monitored, or if you want to dig deeper, use Instrumental’s Detect AI to quickly identify outliers. To do that, click Select a region (1) and then choose Most anomalous (2) to highlight the most abnormal units at the top.
Identify and isolate defect mode(s)
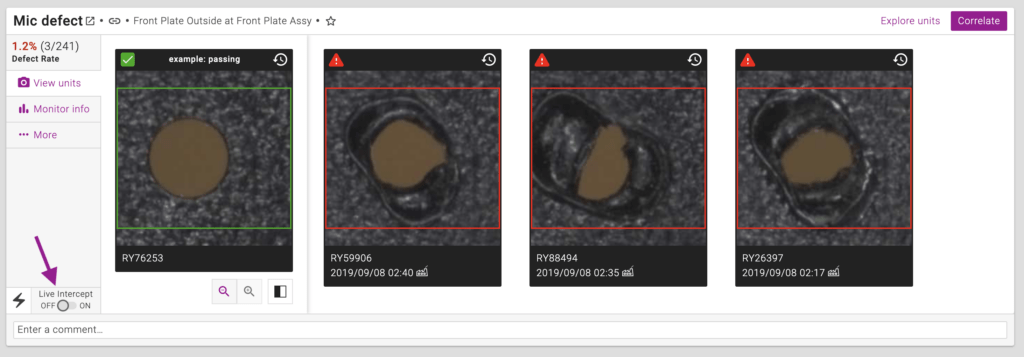
Once you have used Instrumental to highlight the anomalous units, you can quickly see if these anomalies represent defect mode(s).
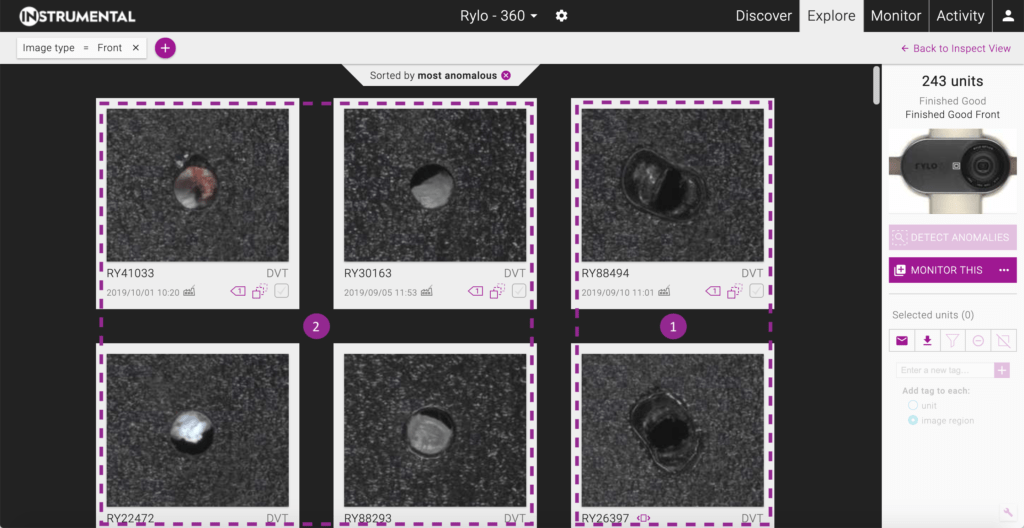
Here, we see two modes, a potential molding defect (1) and contamination (2), both of which could impact mic performance. Contamination is an issue, but the damage to the mic port seems more concerning. Let’s investigate this further by clicking on the bottom right unit thumbnail.
Investigate the defect to find root cause
Use Instrumental’s full data record to begin virtual teardown of the unit to determine root cause. Where did this mic port damage happen? By examining photos of the unit earlier in its assembly, we can see that the Front Plate Assembly image has the same mic port damage.
This is an IQC station, so we can quickly determine that the damage is not a process or assembly issue, but rather an upstream supplier issue. We now know what next steps need to be taken and have proof to back it up.
Create a Monitor to Systematically Track the Defect
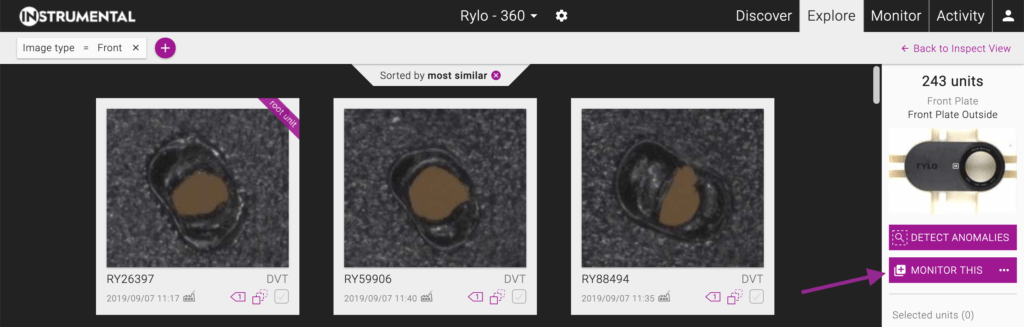
Now that we have a true defect and understand the defect mode, let’s track it to catch any new units that get built with the same failure. On the left hand panel, click Select a region (1) and then select Most similar (2) to perform this search. Monitors work best when the region is closely cropped around the feature of interest so that unrelated variation does not interfere.
Once you click Most similar, the system will find units with the same defect mode and bubble them to the top. You can then create a test for this issue by clicking the MONITOR THIS button on the right-hand panel.
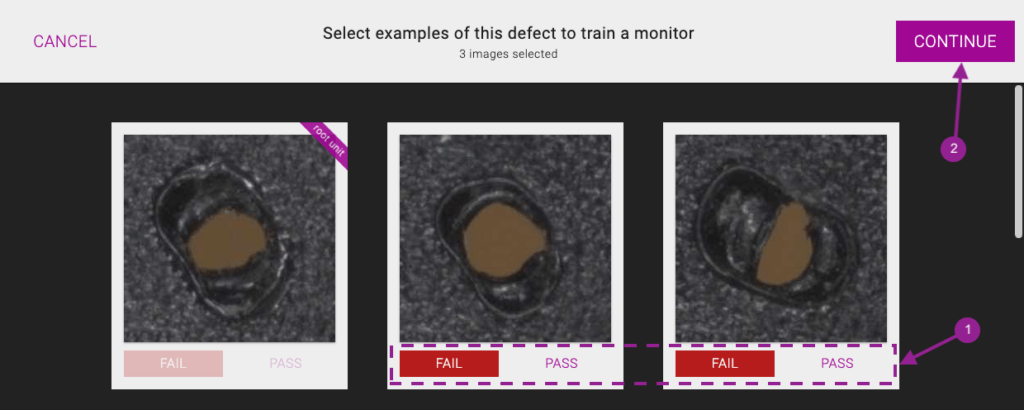
Train the monitor by selecting which photos show passing or failing variation by clicking the respective buttons under each thumbnail (1), then click CONTINUE (2).
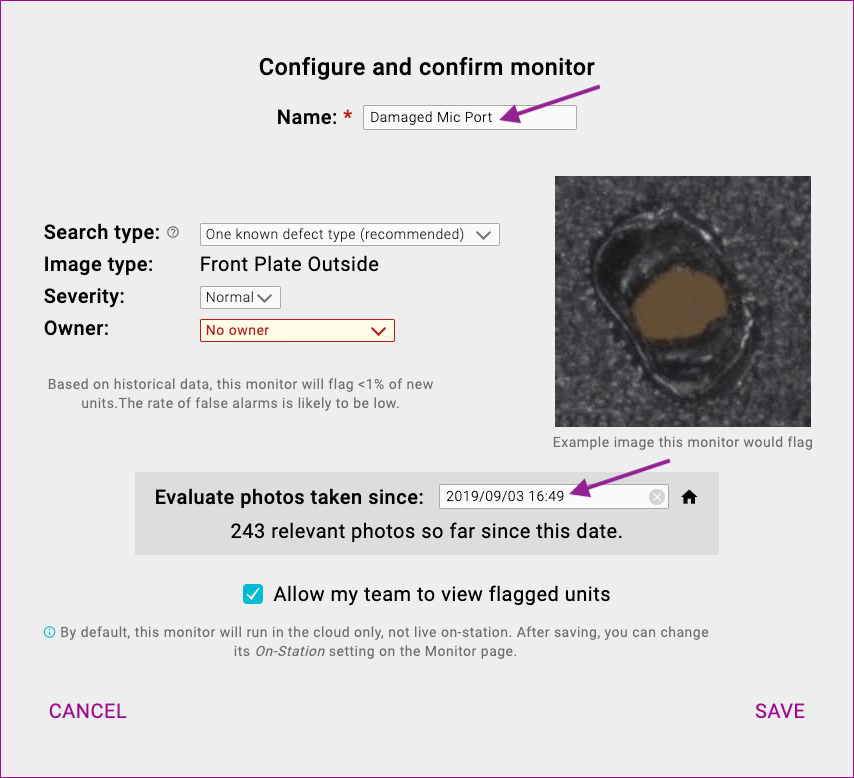
Next you will see a confirmation modal where you can name the monitor. You can also “backdate” the monitor to find defects in units that have already been built (the system will pick the maximum allowed backdating by default). Then click SAVE.
You will get a confirmation modal with a link to view your new monitor. You can also find it later in the Monitor tab.
Note that when you save a Monitor, it will only track units in the cloud by default. If you want to use the Monitor to notify line operators of passes or failures, you can do that from the Monitor tab after saving.
Drive corrective action to fix the issue
Share a link
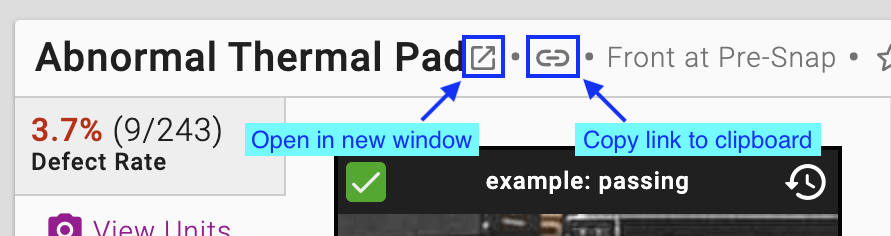
Easily share what you’ve found with relevant people by sending them a link to the monitor you’ve just created. Each monitor has its own page with a unique URL, which can be accessed by clicking on that monitor’s name or icon next to it. You can also directly copy the URL to your clipboard by clicking the link icon.
You can also assign a colleague as the “Owner” of the monitor, which will send them a notification email.
Mention someone in a comment
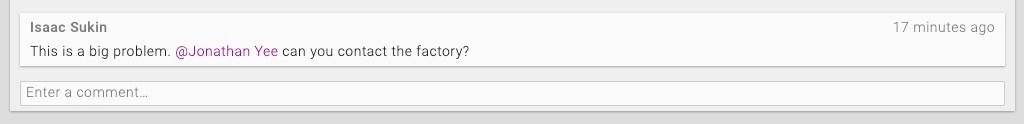
Another option for sharing is to comment on the monitor. You can @mention a user to send them a notification email.
Export a PDF report to share
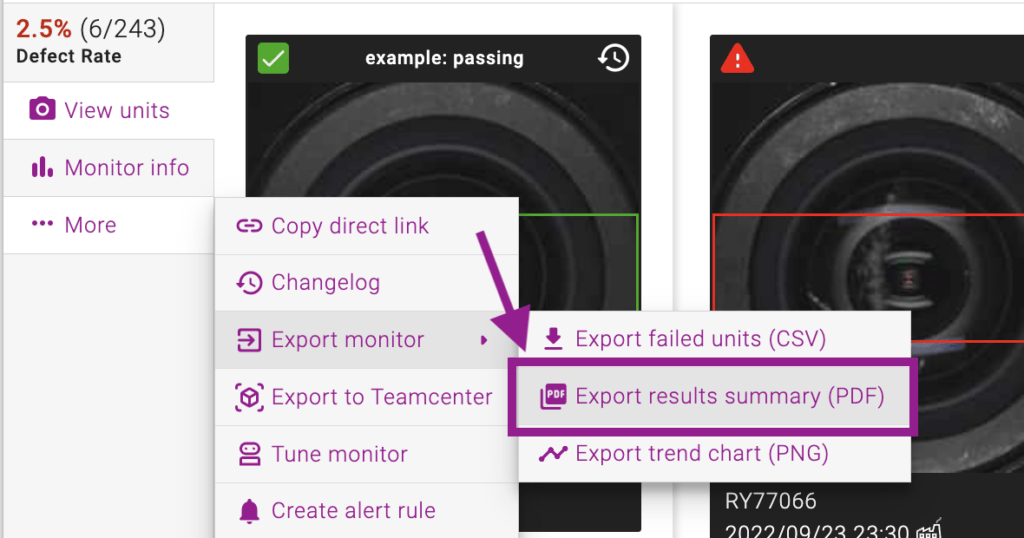
If the person you’d like to share with doesn’t have Instrumental credentials (e.g. an upstream vendor), you can export the monitor as a PDF report to email to them by selecting: More > Export monitor > Export results summary (PDF):
Create a real-time alert to track the issue
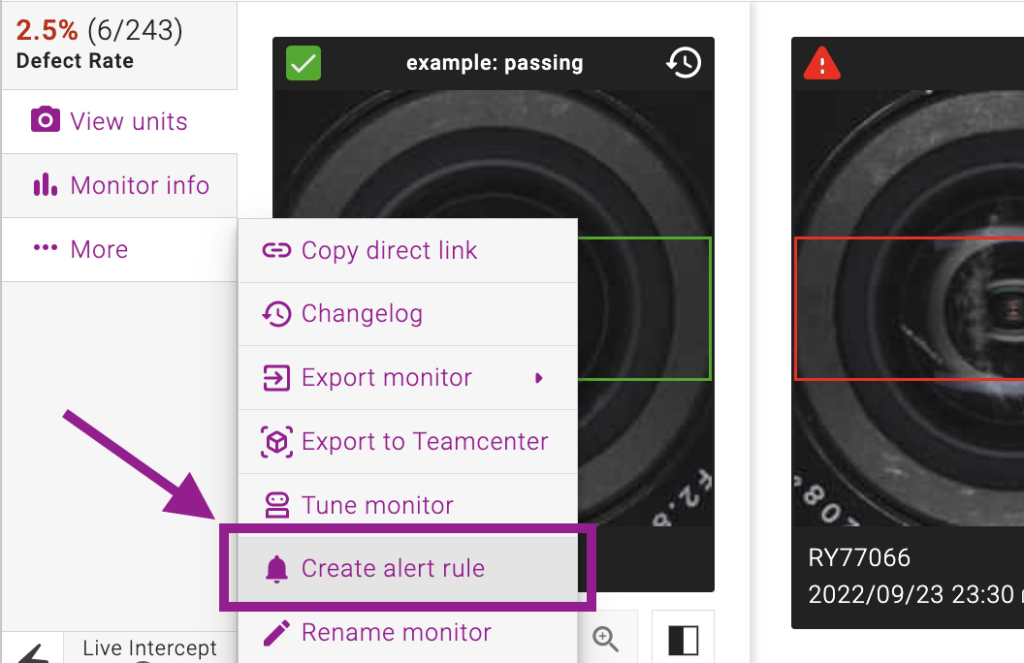
Depending on the severity of the defect you’ve monitored, you may want to be directly notified if this issue happens again, or is failing above a specified rate. To be notified of this, you can set up an Alert. To do this, select More > Create alert rule:
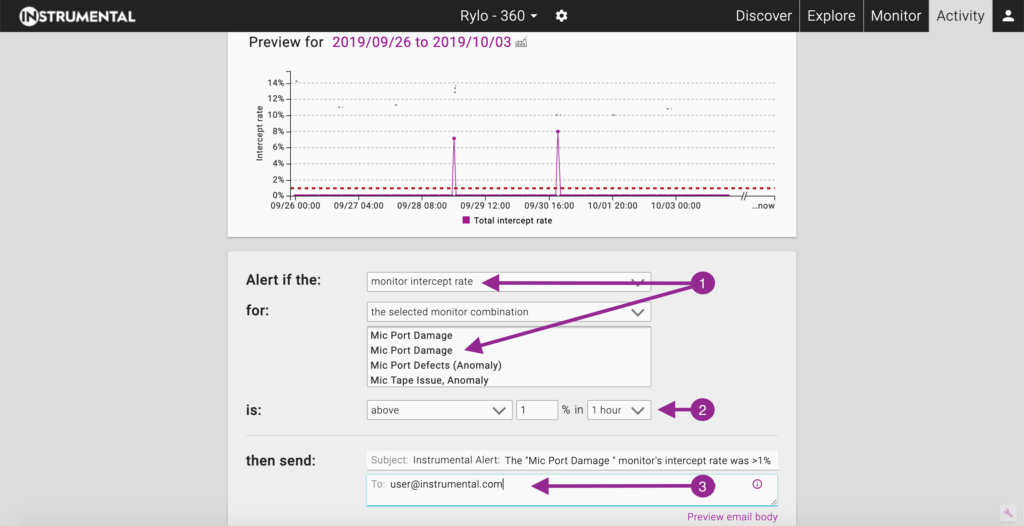
On the alert rule page there are three key areas to configure. First, you’ll want to confirm that you are setting up an alert for the Monitor highlighted based on the intercept rate (1). Next, you can set the alert threshold and frequency in (2). Finally, you can select as many people to send the alert to as you like by adding their email addresses in the field (3). You can also edit the email subject line above should you choose to. Then click SAVE at the bottom.
You can always make changes or turn off the alert later. You can find existing alerts on the Alert Rules page.
Intercept defects in real time
Once you have validated the issue is a problem and you have set up a Monitor, you can push the Monitor live to the line with the Live Intercept toggle. The system will alert operators or the shop floor system the next time this issue is detected so they can take corrective action. Live Intercepts require an Instrumental Station or In-Factory Server.