

Support / How do I find and investigate a defect based on a Serial Number of a unit with a known issue?
Instrumental makes it easy for you to investigate a known issue if you know an affected unit’s serial number. Once you’ve found the defect, it is easy to find more units with the same visual defect.
You can also use Instrumental to easily share your findings with your teammates and alert operators on the line if the defect reoccurs so they can intercept them in real time and perform corrective action.
Table of Contents
Start on the Units page
Log in to the Instrumental web app and navigate to the Units page to find all of the inspection data Instrumental has on your units.
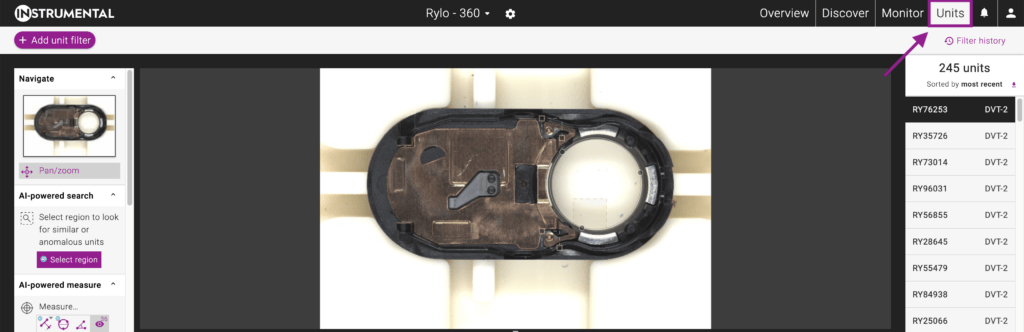
Find a specific unit with a serial number search
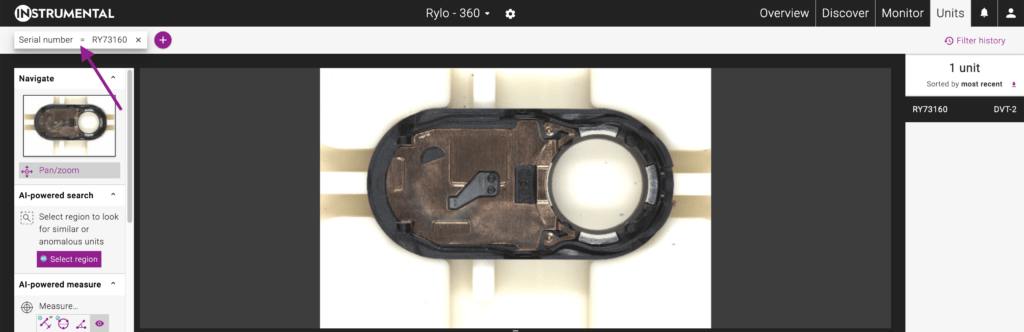
Click the purple “+ Add unit filter” button in the top left hand corner under the Instrumental logo. Choose “Serial number” from the dropdown, choose “=” or “includes” as the operator, and then enter the relevant serial number(s). Multiple serial numbers can be added with a comma separated list, or by pasting a list from Excel.
Tip: If you choose an operator other than “=” and “≠” you can also use an asterisk (*) as a wildcard for a single character.
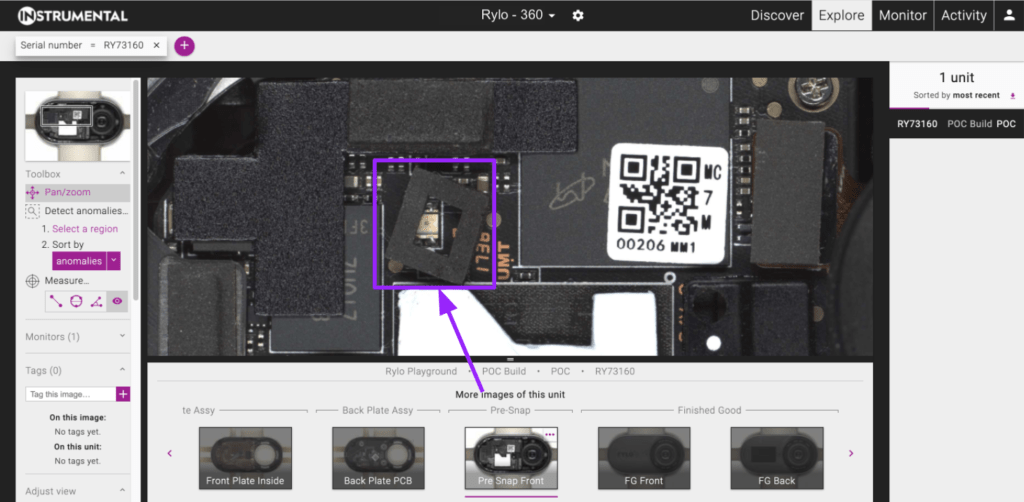
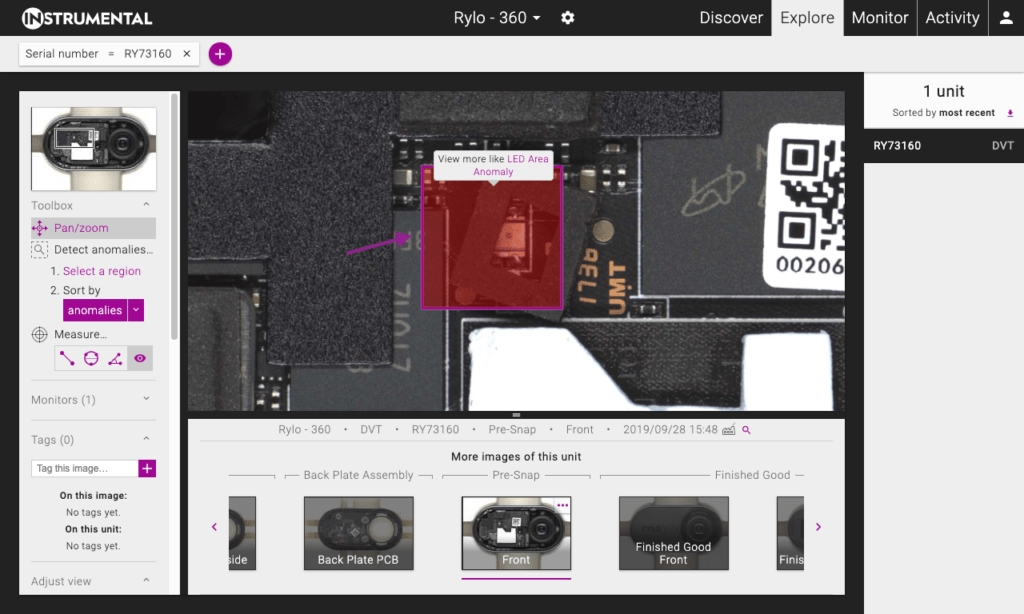
When the search completes, scroll over the image or use the E shortcut key to zoom in on the region or component of interest, such as a misplaced gasket or an unclipped connector.
Find more units like this
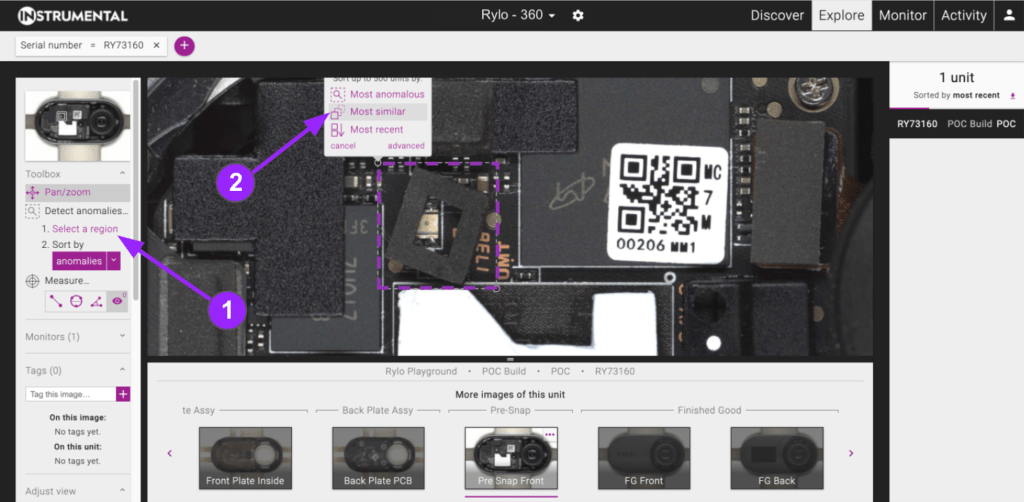
Once you’ve zoomed in, Instrumental’s AI algorithms make it easy to find units with similar issues.
To search your data set for similar units, click Select a region (1), draw the bounding box around the component or issue of interest, then choose Most similar (2). The search will be most accurate if the box you draw is cropped closely around your area of interest so that background variation does not interfere.
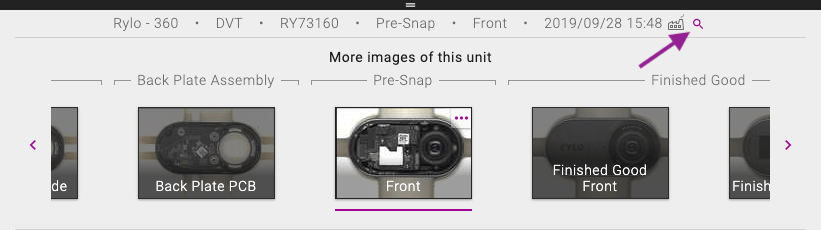
You can also see units built around the same time by clicking the magnifying glass icon in the gallery tray:
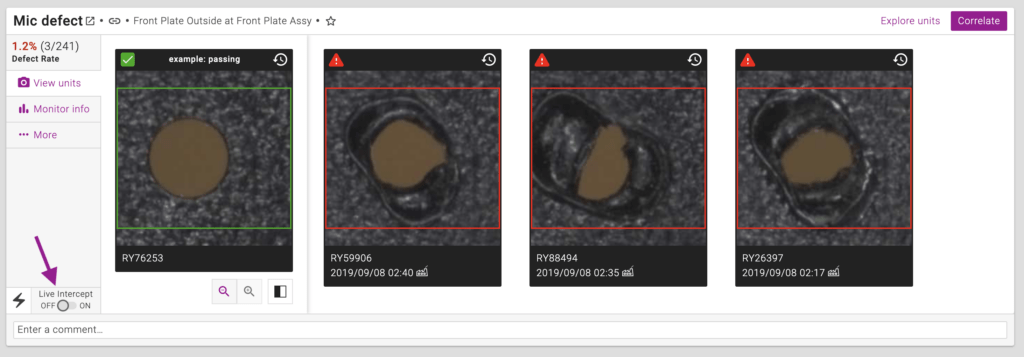
You may also see a heatmap of regions overlaid on top of the image. These indicate if Instrumental has automatically discovered an issue or if a user has already created a monitor for it. Clicking on a region will show the name of the region, which you can click on to see the monitor or discovery and other units that were flagged.
Easily share the results with the team
From a Most similar search, you can send subsets of the results to other team members within the Instrumental app.
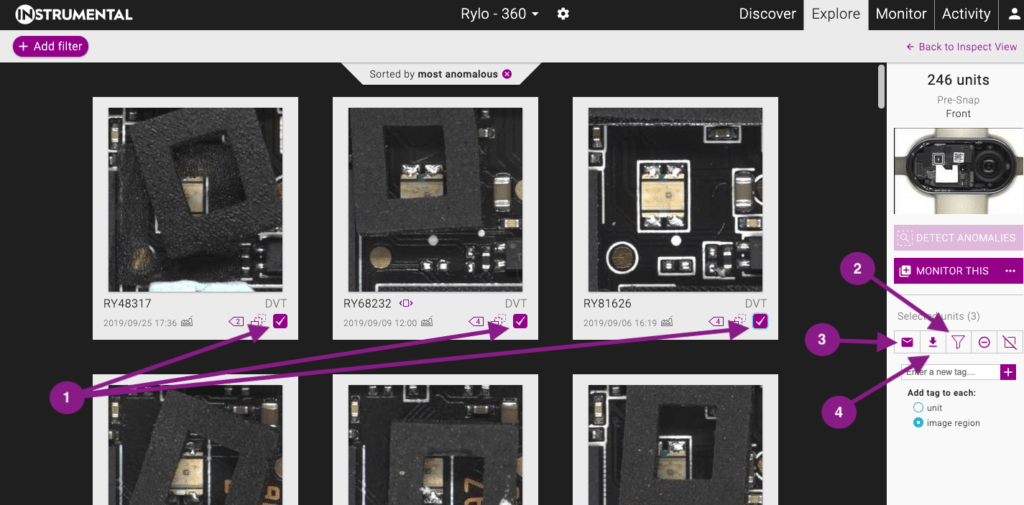
To do this, first select the affected units by clicking on the selection boxes (1) in the bottom right corner of each thumbnail. Then, filter to the selected units by clicking the Filter button (2) on the right menu panel. Once you’ve filtered to affected units you can email the results to colleagues via the Email button (3) or you can download the serial numbers and share those by clicking on the Download Results as CSV button (4).
Monitor for recurrence
Continue the investigation by setting up a monitor. This will allow you to track the issue going forward and even alert operators live on the line so they can intercept bad units and take corrective action. You can also share Monitors with your team. To do this, click MONITOR THIS.
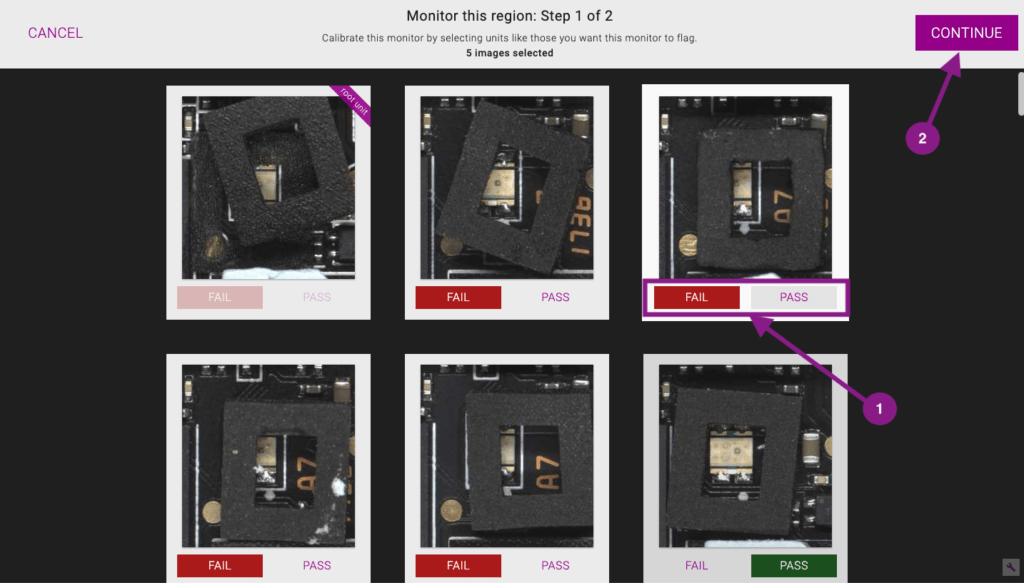
Train the monitor by selecting which photos show passing or failing variation by clicking the respective buttons under each thumbnail (1), then click CONTINUE (2).
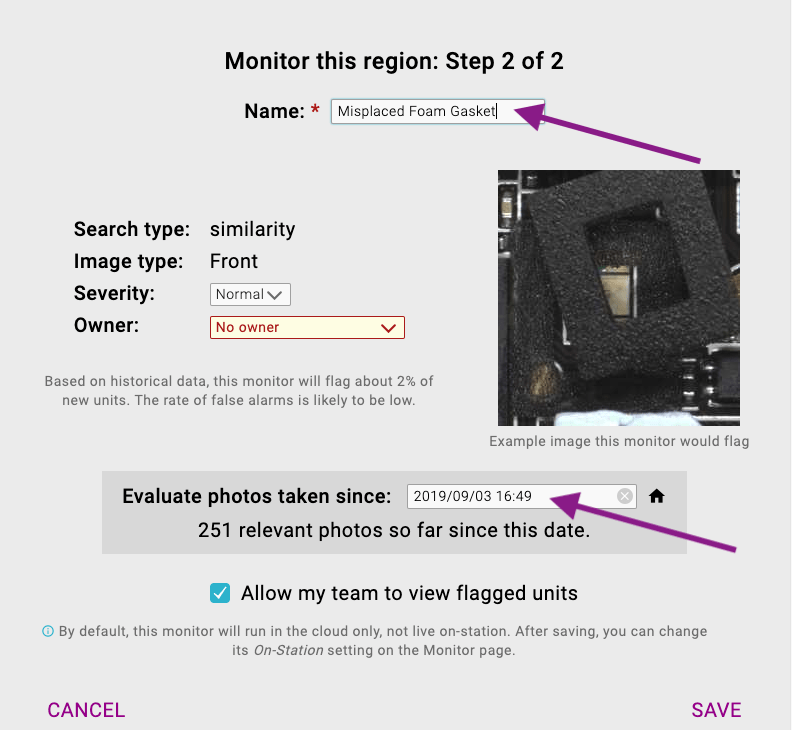
Next you will see a confirmation modal where you can name the monitor. You can also “backdate” the monitor to find defects in units that have already been built (the system will pick the maximum allowed backdating by default). Then click SAVE.
You will get a confirmation modal with a link to view your new monitor. You can also find it later in the Monitor tab.
Note that when you save a Monitor, it will only track units in the cloud by default. If you want to use the Monitor to notify line operators of passes or failures, you can do that from the Monitor tab after saving.
Create a real-time alert to track the issue
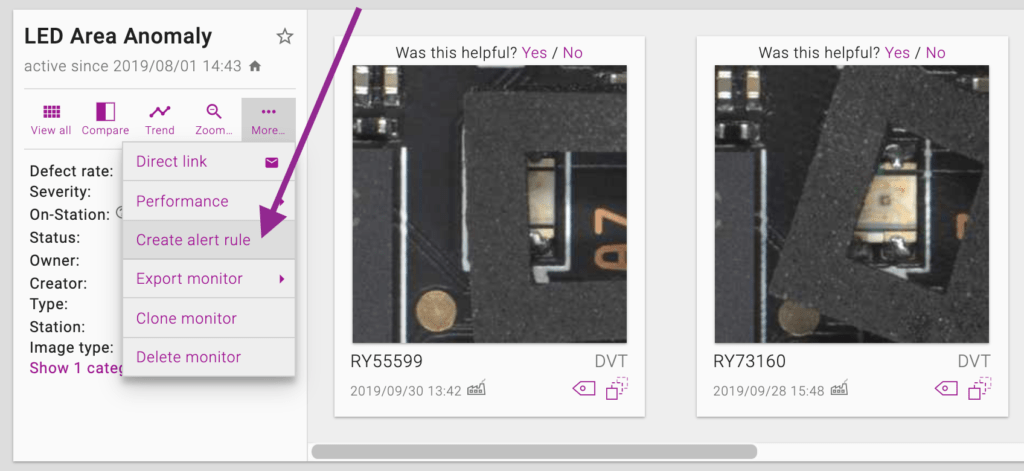
Once you’ve set up a Monitor, you’ll want to know if this issue pops up again. To be notified of this, you can set up an Alert. To do this, go to the Monitor and click the More… button under the Monitor name. Then select Create alert rule.
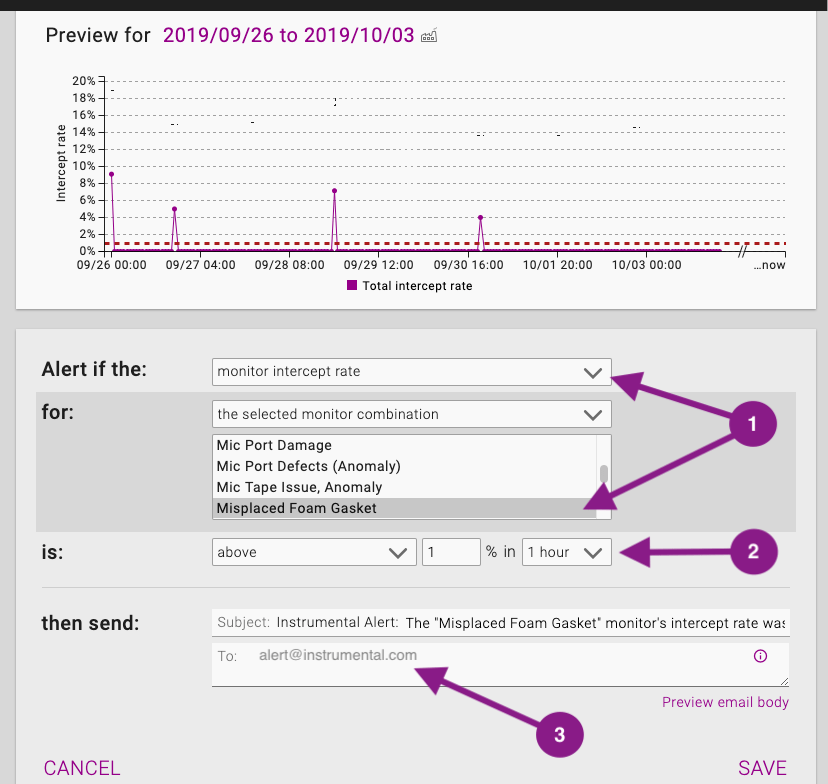
On the alert rule page there are three key areas to configure. First, you’ll want to confirm that you are setting up an alert for the Monitor highlighted based on the intercept rate (1). Next, you can set the alert threshold and frequency in (2). Finally, you can select as many people to send the alert to as you like by adding their email addresses in the field (3). You can also edit the email subject line above should you choose to. Then click SAVE at the bottom.
You can always make changes or turn off the alert later. You can find existing alerts on the Alert Rules page.
Drive corrective action by intercepting defects in real time
You can return to the Monitor page to view units the monitor has caught and review its performance.
Once you have validated the issue is a problem and you have set up a Monitor, you can push the Monitor live to the line with the Live Intercept toggle. The system will alert operators or the shop floor system the next time this issue is detected so they can take corrective action. Live Intercepts require an Instrumental Station or In-Factory Server.