


Support / Changes to Monitors: Summer 2024
Instrumental has released several changes to the ‘Monitor’ feature to improve your experience managing and tuning monitors.
Below please find a list of the changes. If you have any feedback on these changes, or any other feature please reach out to feedback@instrumental.com.
Table of Contents
1. Re-labeling Monitor Results
Instrumental Monitors allow you to easily train your own AIs to to test for specific defects or other important visual characteristics that you want to track.
Monitors may occasionally incorrectly “Fail” a normal unit (false positive), or “Pass” a defective unit (false negative). This indicates the Monitor needs to learn through additional training. When you correct a Monitor’s mistake you not only fix the Pass/Fail for that one unit, you teach the model to be more accurate in the future.
With the 2024 update Instrumental has made it easier to fix mistakes and retrain your Monitor AIs.
Identifying False Positives
If you spot an instance where you believe a unit has been incorrectly “Failed” by a monitor (a false positive) you can re-label the unit as a “Pass”. To do so simply mouse over any monitor image that should not have failed and select the checkmark icon at the top.
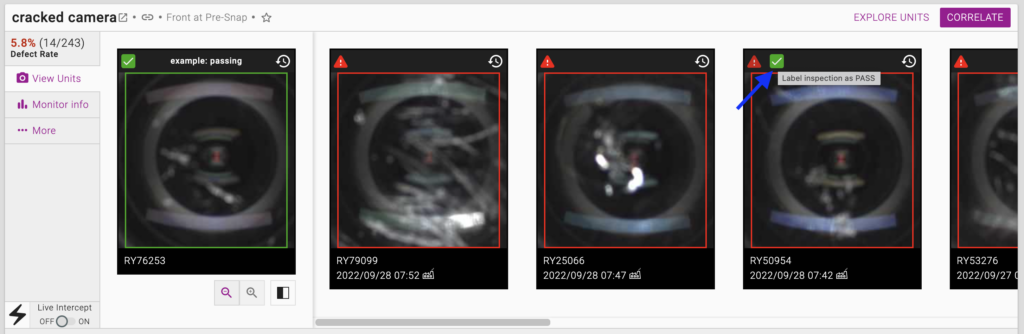
Relabeling an inspection will:
- 1. Change the result for that monitor on that inspection to “PASS”. This will be reflected in statistics shown throughout Instrumental (defect rate, etc).
- 2. Record the change in the Label History and Changelog. You can always use the Changelog to audit the initial label and most recent re-label on a monitor.
- 3. Automatically schedule a retraining for the AI, to incorporate the new label. Typically the monitor will retrain within 15 – 45 minutes.
If you do not want the retrained model to automatically take effect, you can require user confirmation. See “Controlling Monitor AI Retraining” below.
Identifying False Negatives
If you become aware of a unit that “Passed” when it should have “Failed” you can now re-label it on the Unit page:

Controlling Monitor AI Retraining
AI Automation Settings: There is a new project settings section called “AI Automation Settings”. You can navigate to it directly by going to the “Project Settings” screen, or use the link to it which shows up in the “Train new AI model” badge, which appears after re-labeling an inspection.
By default this will be set to “Automatic“. The retrained monitors will immediately be used for all new inspections, once the retraining is complete. It will not be applied to previous inspections. Please note: for “Live” monitors to take effect in the factory, there needs to be an active internet connection to the station. If there is not, the retrained monitor will take effect the next time the station is connected to the internet.
If the setting is changed to “Manual” then a user will have confirm each individual monitor update before the retrained model will take effect. Users will see a “New AI model available” badge on a monitor once the retraining is complete. Click “Apply model” to have the new model take effect:
![]()
Permissions: There are two user permissions which control whether a user can:
- Change monitor results by relabeling
- Approve new models (if required — see ‘AI Automation Settings’ above).
If you would like to change your permission, or the permissions for other users, please reach out to your Instrumental representative.
2. Monitors: Layout Changes
| Old | New |
|---|---|
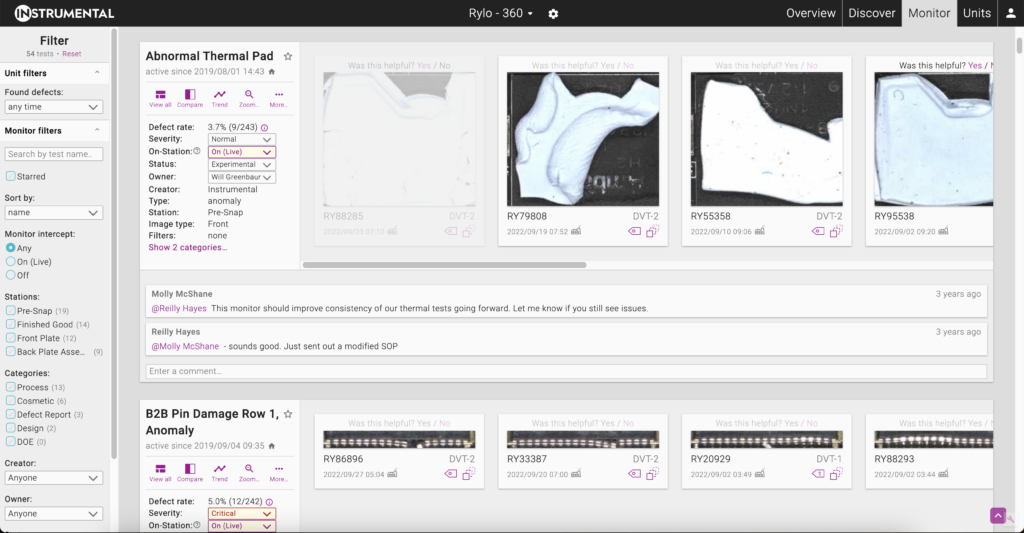 |
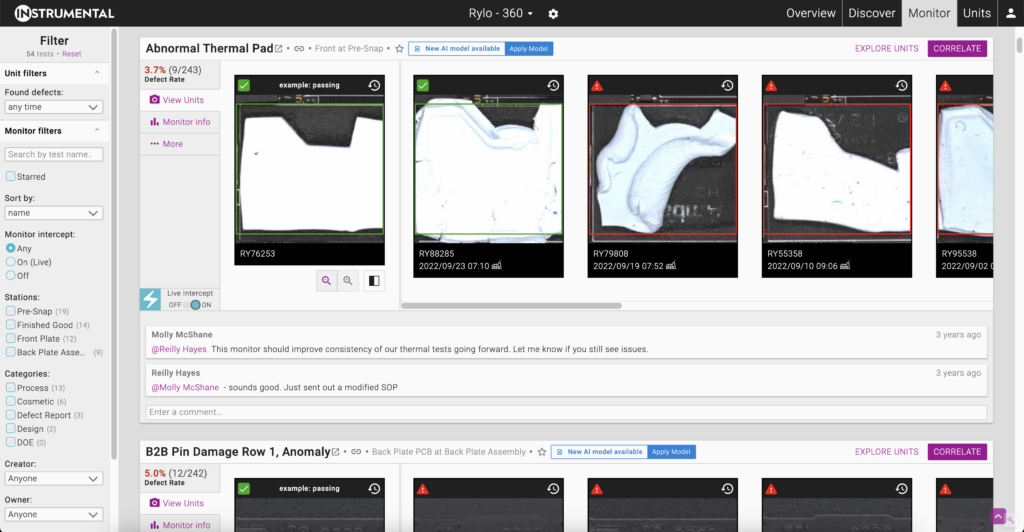 |
Top-level Actions
The layout for individual monitors has been re-designed to make the most important information and actions more prominent:
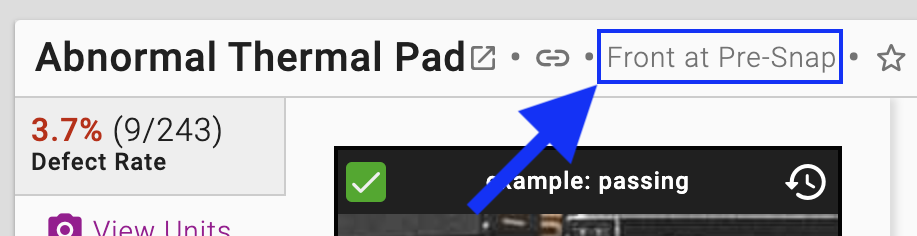 |
Inspection Run On: Each monitor’s top bar now contains information which station inspection it is run on, and the specific configs (e.g. SKUs) it is restricted to, if applicable. |
 |
Direct Link to a Monitor: Each monitor has its own page, which can be accessed by clicking on that monitor’s name or the ‘open’ icon next to it, to open a new tab for that monitor.
Alternatively, you can click the link icon to copy the monitor’s URL to your clipboard. |
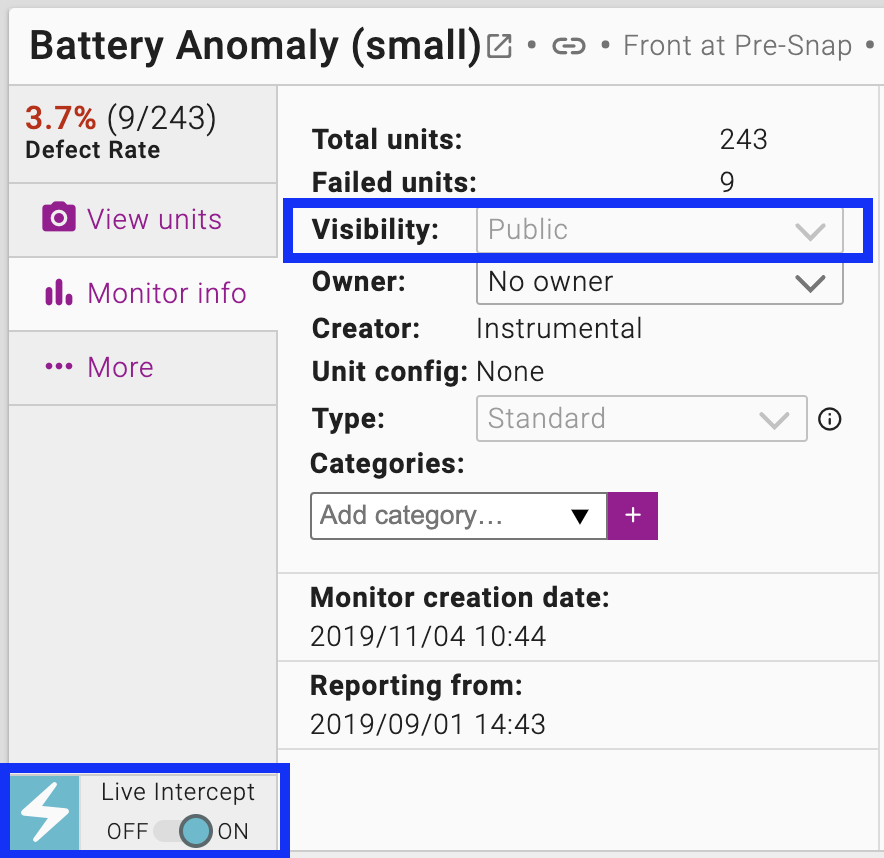
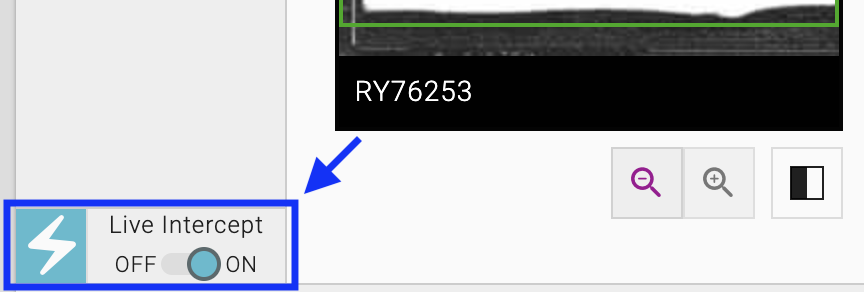 |
Live Intercept Toggle: Setting a monitor to intercept units live on your manufacturing line (pass/fail) is one of the most consequential actions you can take. Therefore we’ve made this setting more visible to ensure you know which monitors are live. |
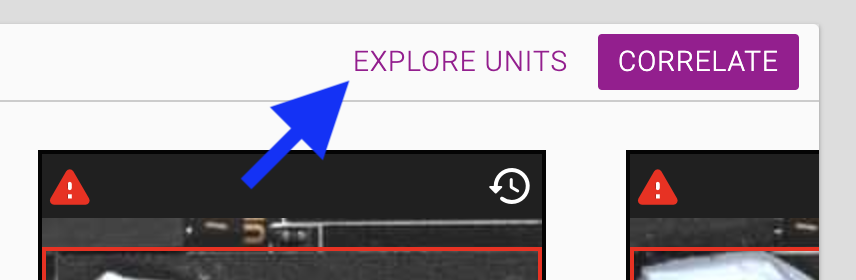 |
Explore Units: This will bring you to the Units page, filtered to all units that flagged this monitor. From there you can download the S/Ns and other inspection data for those units, apply additional unit filters to further narrow the units you’re looking at, or switch to the ‘inspect’ view to view additional assembly images for the flagged units. |
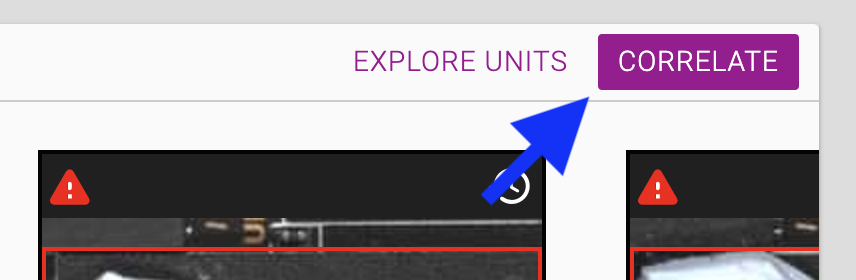 |
Correlate: The ‘Correlate’ action will take you to the Correlations page with this monitor’s pass/fail selected as your root metric, making it easy to find the strongest relationships between this defect and your other unit data (test data, etc). |
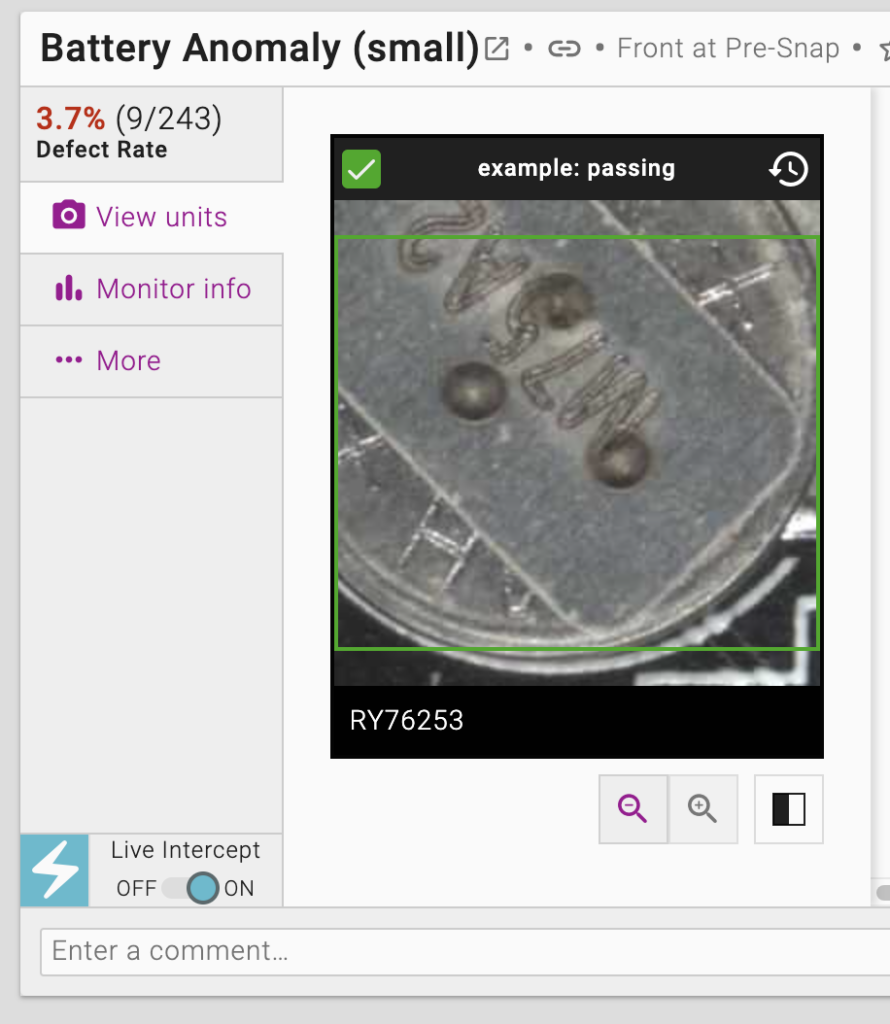
Tabbed View
The monitor view has been further broken up into three tabs:
- “View Units“: This view is optimized for reviewing recent results, with tools to investigate images of units that have recently ‘failed’ this monitor.
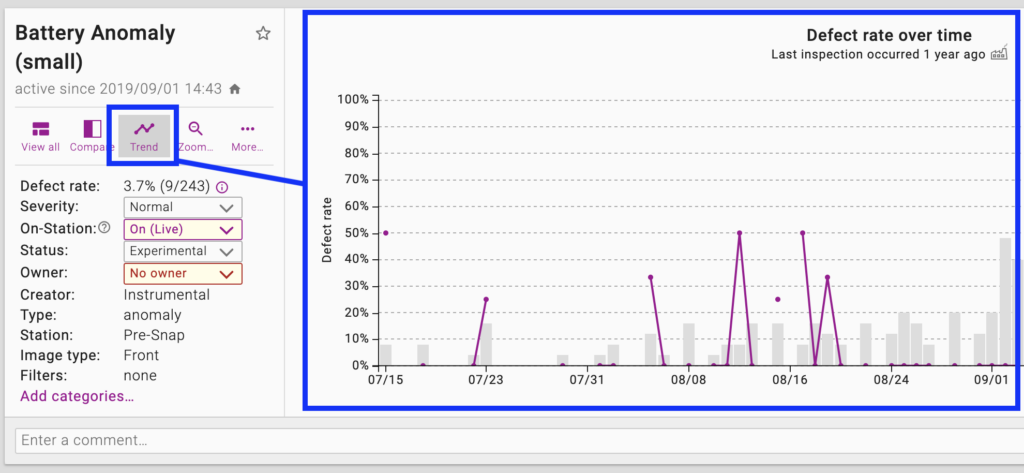
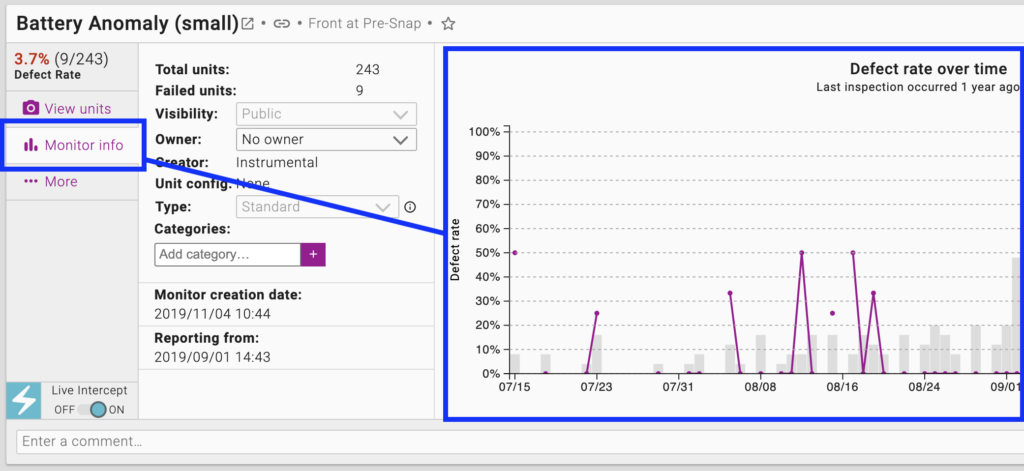
- “Monitor Info“: This view is optimized for managing the monitor, including a chart of the defect rate over time and basic monitor characteristics.
- “More“: The More menu is where you can find advanced actions, which are only needed in specific circumstance.
Other Layout Changes
| Feature | Old Location | New Location |
|---|---|---|
| Timestamps
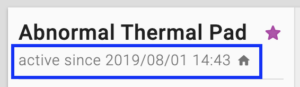
You can now find two timestamps under the “Monitor info” tab: ‘Monitor creation date‘ and ‘Reporting from‘. ‘Reporting from’ is equivalent to the prior ‘active since’ timestamp, and reflects the first inspections this monitor was run on. Please note that this is often before the creation date as monitors may be set to run on previous inspections when created. |
 |
 |
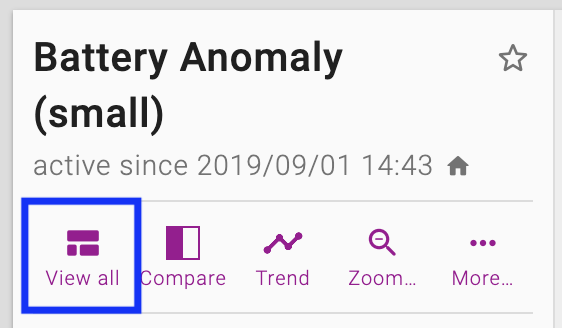
| View all → Explore Units
If you would like to view or investigate all of the units flagged by this monitor on the ‘Units’ page you can click “Explore Units”. This will take you to the ‘Browse’ view, which shows the monitor region on multiple units, with the appropriate unit filter set. Select “Back to Inspect View” to see the individual units. |
 |
|
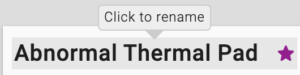
| Rename a monitor
Renaming a monitor is now available under the “More” menu. Clicking on a monitor’s name will take you to the monitor’s individual page. |
 |
|
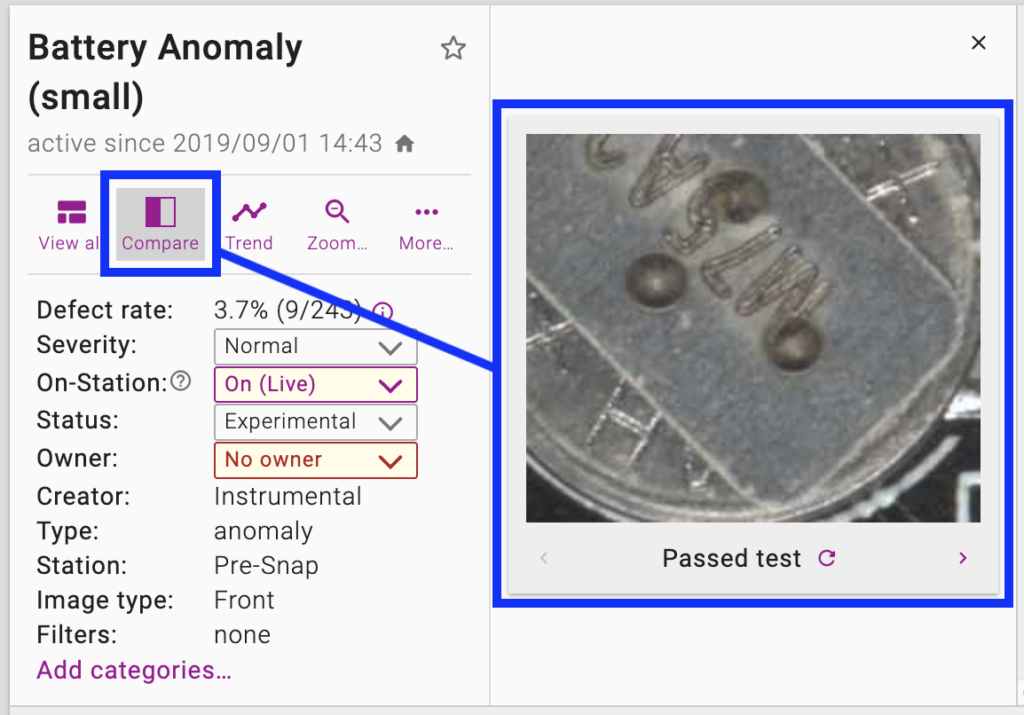
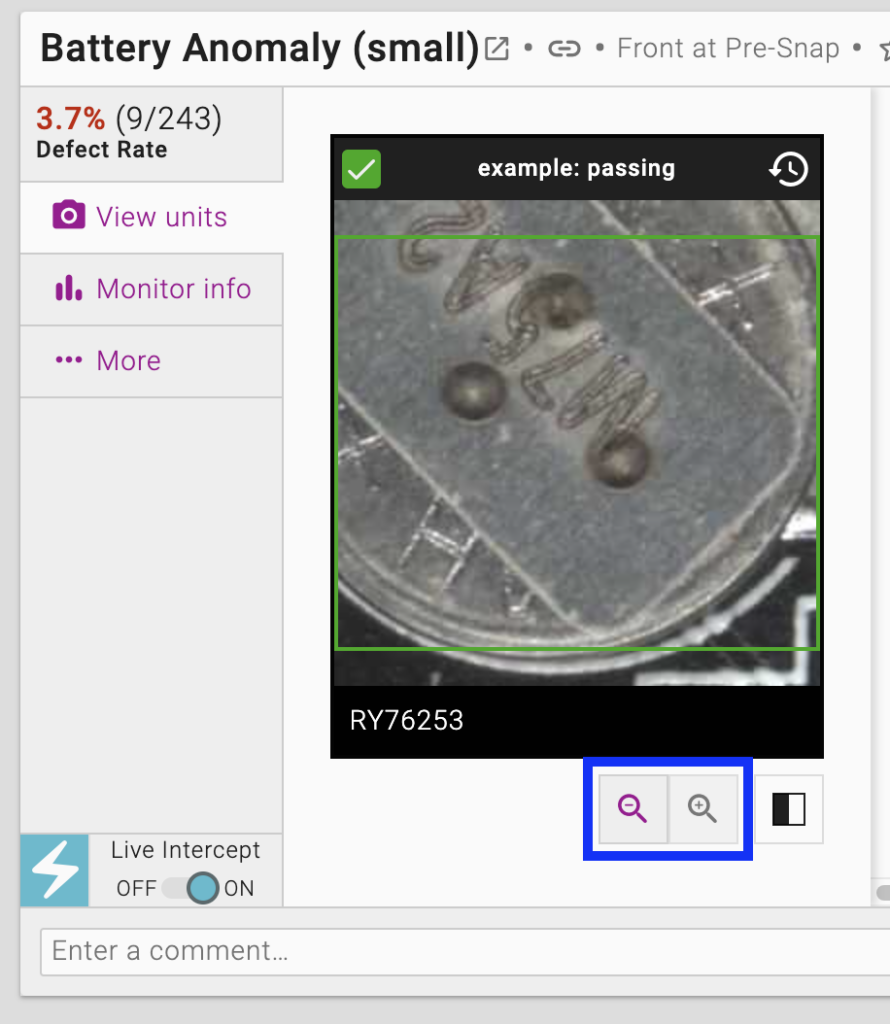
| Show a “PASS” example unit
You no longer need to select “Compare”. A passing unit is now shown by default on the ‘View units’ tab. |
 |
 |
| Defect Rate Trend Chart
You no longer need to select “Trend”. The defect rate trend chart is now shown by default on the ‘Monitor info’ tab. |
 |
 |
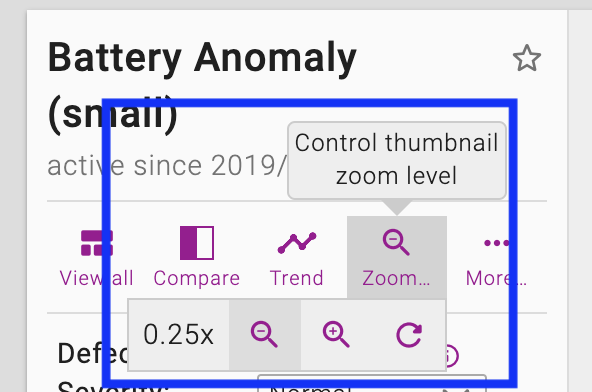
| Zoom
The zoom in/out controls appear below the passing example image. |
 |
 |
| Visual Comparison
To see the differences between the “PASS” example and each of the failing units, you can select the “Compare” control below the passing example image. This will overlay the failing unit images with purple, highlighting the differences. Please note: This is intended to be a useful tool for you to spot the differences between the passing and failing unit. However it does not necessarily reflect the reasons a monitor’s AI flagged the unit, which can be based on complex features. |
Not Available | 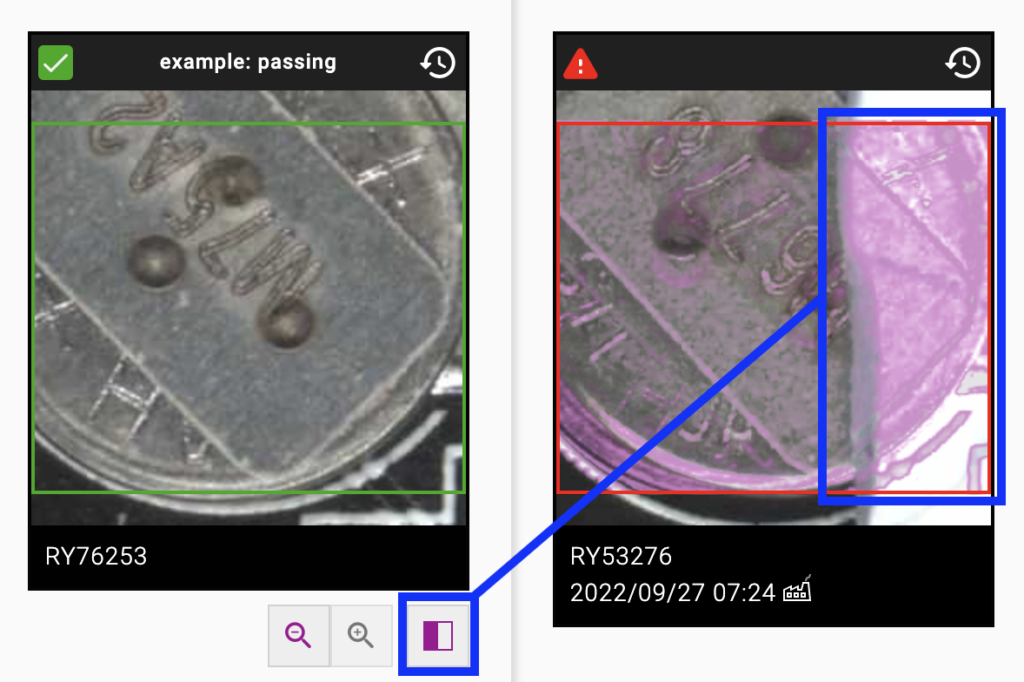 |
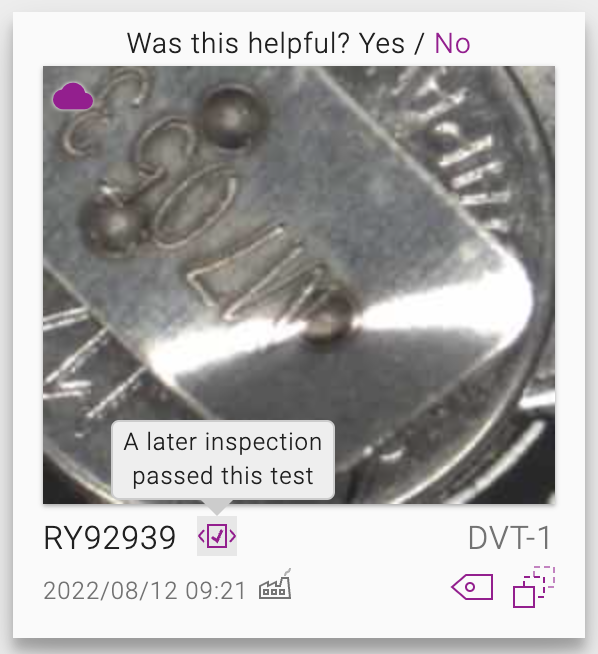
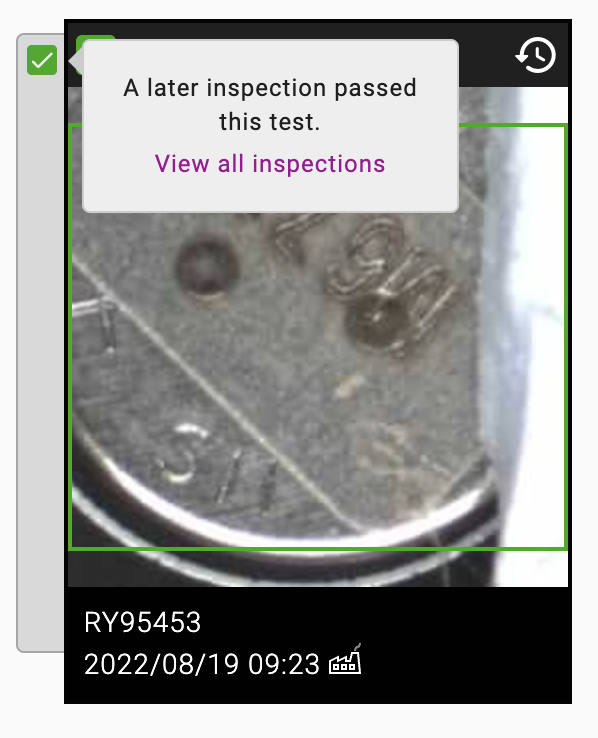
| Re-Inspection Indicator
When a unit has multiple inspections for a monitor you will see the image crop from the first inspection on the Monitor page, with a ‘shadow’ behind the crop card, with an icon in the upper left which indicates whether the final inspection was a “PASS” or “FAIL”. Clicking on the icon will bring up a link to see the images from all inspections. |
 |
 |
| Monitor info > Severity
We have removed the ‘Severity’ property from Monitors. |
 |
Deprecated |
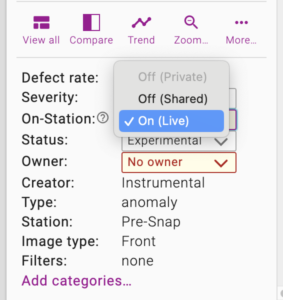
| Monitor info > On-Station
The “On-Station” dropdown previously controlled whether the monitor was:
These have now been split into two controls:
|
 |
 |
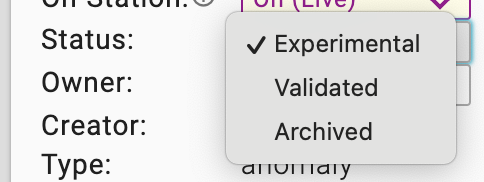
| Monitor info > Status
We have combined the ‘Experimental’ and ‘Validated’ statuses to simply indicate a monitor that is not archived, and removed the dropdown. To set a monitor to be ‘Archived’ use the “Archive Monitor” action under the “More” menu. Please note: Archiving a monitor is still an irreversible action. |
 |
 |
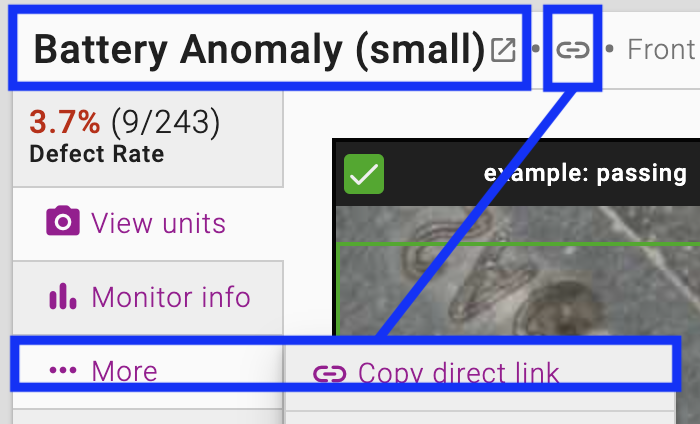
| More > Direct Link
The “Direct Link” action has been made easier to access, and less disruptive. Clicking on a monitor’s title or the adjacent icon will open the individual monitor’s page in a new tab. Clicking the link icon in the title bar or the “Copy direct link” action in the “More” menu will copy the link to your clipboard. |
 |
 |
| More > Performance > Manage performance
This has been removed as it is unnecessary with the automatic model retraining. Please see “Controlling Monitor AI Retraining” above for more details. |
 |
Deprecated |
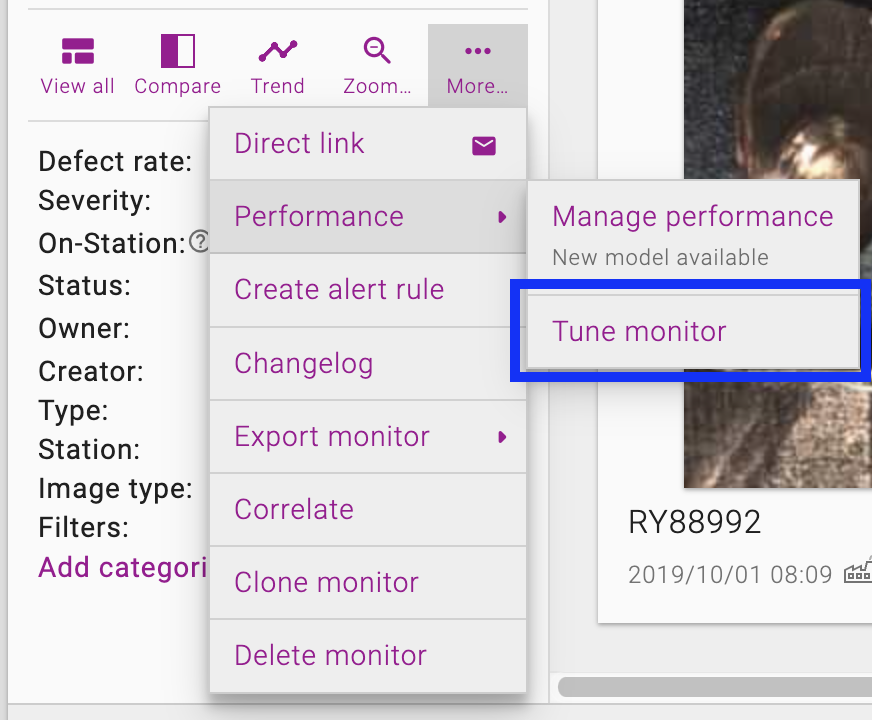
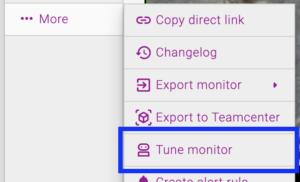
| More > Performance > Tune monitor
This has been moved to be a top level item in the “More” menu. |
 |
 |
| More > Correlate
This has been moved to be a top level action in the upper right corner of the individual monitor view. |
 |
|
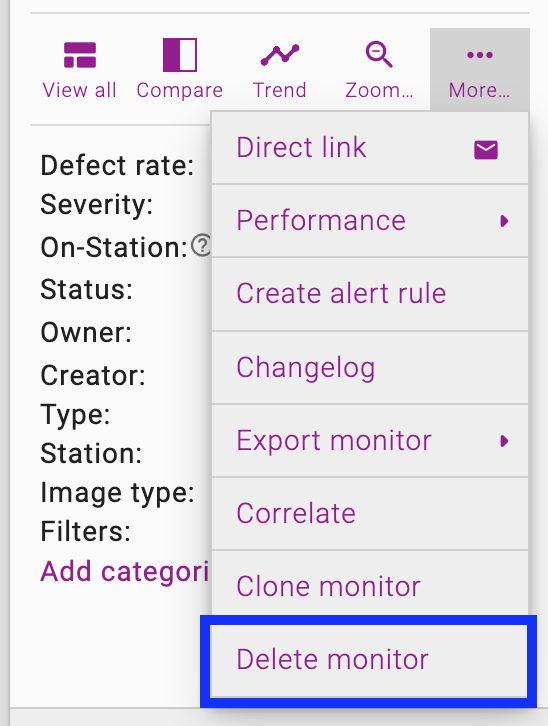
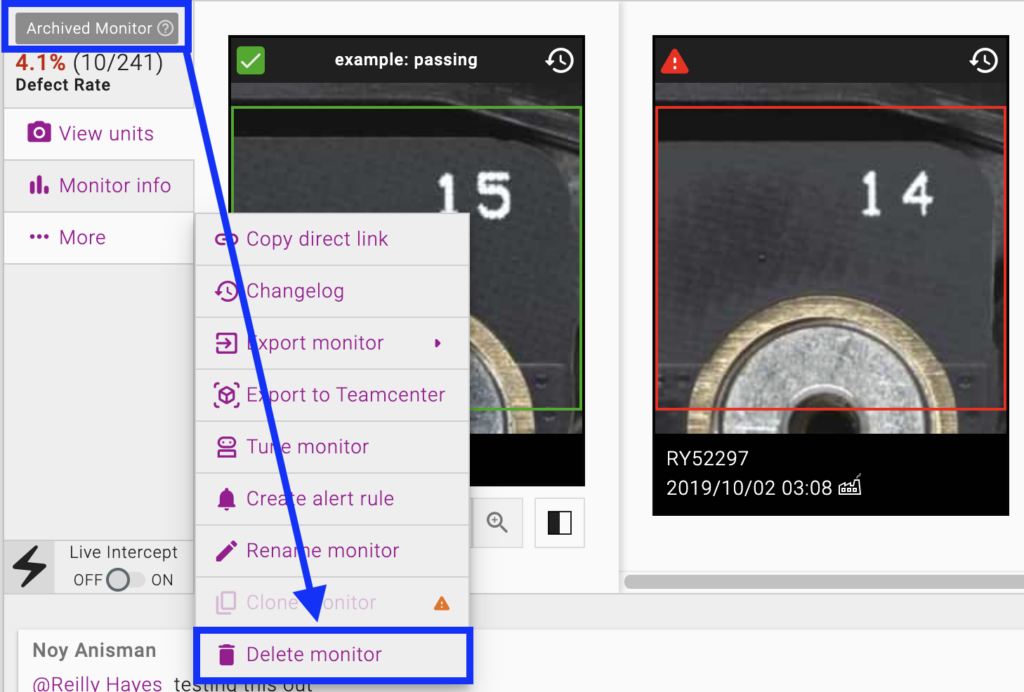
| More > Delete monitor
With this update, a monitor must be archived before the option to delete it will appear. |
 |
 |