


In part 1 of our failure analysis series, we shared the best ways to find the sources of failure modes in development. In part 2, we’ll share a few failure analysis tools and methods you can use to solve those issues once you’ve identified them. While these failure analysis tools can help you collect data, organize your thoughts, and prioritize your options, there is no substitute for good engineers to propose hypotheses to test and to run the experiments.
You can start by doing preemptive analyses before you commit to releasing tools and gearing up for a build. As we mentioned before, prevention is the best way to solve issues. Of course, when you are in the middle of a build, it’s hard to prevent what already has happened so at this time, good documentation is key.
That’s why it’s so important to have the data you need before an issue presents itself, so you don’t need to waste time re-collecting it. The value in this data extends beyond solving the problem, but is the only way to convince other teams to provide support or alter processes, and ensure management understands what additional resources you may need.
Documentation is great – but don’t let it be an afterthought. The more clear and unassailable data you have to work with, the easier it will be to make correlations.
Preemptive Analyses:
The following methods are useful for identifying issues and prioritizing them before you have any physical parts meaning you can get a leg up on failures through prevention.
FMEA
FMEA – which stands for Failure Mode, Effects, and Analysis – is a useful framework for identifying failures before they occur. The goal of this effort is to come up with a prioritized list of potential issues to address BEFORE you commit to finalizing a process or part. It relies on having your development team take a step back from the intimate details of the product and consider the weaknesses of the manufacturing processes. They should then score the risks and likelihood of problems occurring. Those processes and failure modes with higher scores should get a second look and mitigation plans should be created to deal with them before a release.
To hold an FMEA, ask your teams to set aside some time to evaluate the manufacturing processes and how they can go sideways. Any step along the way can have one or more potential failure modes to assess.
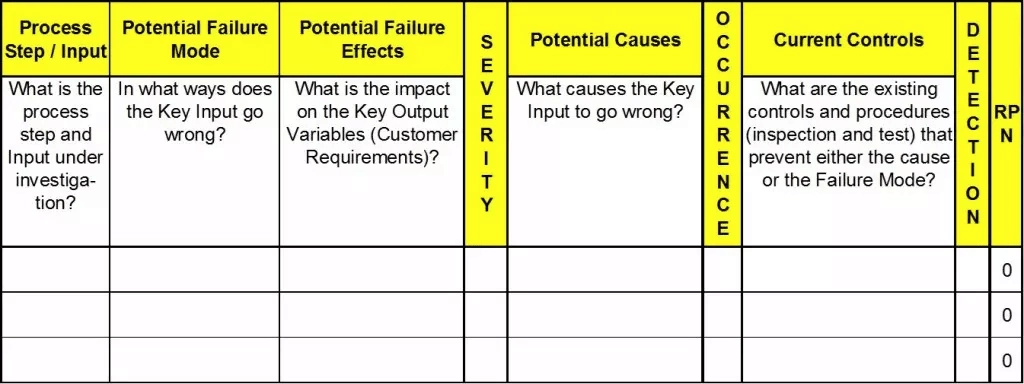
Credit: Six Sigma DSI https://sixsigmadsi.com/how-to-complete-the-fmea/
A traditional FMEA is scored on 3 axes which are:
- Severity of Failure
- Probability of Occurrence
- Probability of Detection
Each of these are given equal weight and scored on a scale of 1-10. The rating for each category is then multiplied to create a final score that can be sorted from highest to lowest. If you did it right, the problems with the highest risk should rise to the top. If something feels off, look again at your scoring values and make sure your team agrees with the numbers.
Once you have your list of failure modes, assign a DRI to create a mitigation plan and hold periodic review meetings to make sure enough of the predicted problems have been addressed to move forward. FMEAs are most useful early in a program when there are still a lot of unknowns and processes are being developed, but can and should be used as processes change or stabilize and new failure modes are identified.
A helpful resource that dives deeper into how to run an FMEA can be found here:
https://sixsigmadsi.com/how-to-complete-the-fmea/
If the traditional FMEA feels cumbersome, you can customize this style of prioritization process to fit your product by adding or substituting metrics to this framework. For example you can introduce scores for Cost, Effort, or Schedule Impact if those risks are more salient for your project. You can also expand the scope of the type of failure modes beyond manufacturing processes and into the mechanical or hardware architecture.
Also, a way to create a clearer prioritization is to use a more limited exponential scoring set. This would force your team to rate something as 1, 3, or 9 from Low, Medium, to High risk. This helps to reduce a lot of intermediate scores where everything comes out to the same number and it is hard to prioritize.
Simulation
Another way to get data from your designs before committing to large spends is through simulation. If you have members of the team who are able to use advanced FEA – or Finite Element Analysis – tools like Ansys, Abaqus or the simulation packages in CAD programs like Pro-E, Solidworks, or NX, you can set up simple simulations of the most demanding reliability situations such as drop tests, ball impacts, or twist and torque tests.
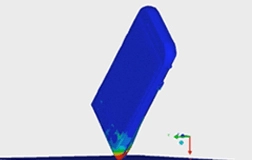
Credit: https://www.ansys.com/products/structures/ansys-explicit-dynamics-str
Since simulations can take some time to set up and a lot of computing power to complete, make sure to use enough fidelity in the simulation to accurately capture how the elements will behave, but not so much that the simulations become your long lead process.
As designers, you can use your intuition to identify weak areas of the architecture to simulate. Then identify reliability tests that might push the product, especially in those weak areas, to its limits and give you something to compare against later. Often weaknesses exist at points that have the least amount of physical material like in a tapered corner, or where an impact wave might ripple through a sudden change in stiffness as in a screw boss or sudden material change.
If your components exceed the material stress and strain values in simulation, you should expect products in the real world to crack or tear. Additionally, you may find that instead of a crack, the pressure may release in another way where retention features slip past one another.
Record Keeping
Like much of the Hardware Development process, keeping detailed and accurate records during failure detection and throughout your investigations will help you tremendously in failure analysis. Being able to go back after the fact to find details, images, or video of a failure and the situation that may have caused it is critical to disseminating the information to a broader team, as well as to reconstructing the situation and looking for root cause.
Major Issues List
As issues come up in development but especially during a build, it is useful to record the issues in a master database or spreadsheet, often called the Major Issues List or MIL. If your team is on top of using tools like JIRA or other online forms and your factory has good, consistent connectivity and access, use your digital tools. Otherwise, you can also use simple offline spreadsheets as a quick and easy way to start your list at the builds.
Record as much data as you can about what the failure is, where in the build process it was discovered, how it might be produced (if known) and how many products were identified that exhibited this issue. You should also indicate the severity level of the issue, whether it can be screened out or not, and assign a DRI, functional area, and status. Some of these metrics can be used as KPIs such as counting how many issues were found for each discipline or keeping track of how many bugs still need to be fixed before a project can move to the next stage.
At builds, open issues should be reviewed daily or even per shift with the assigned DRI tasked with doing initial root cause analysis and pulling members of the team together to investigate. As your investigation progresses, your issues should have a short-term and long-term fix so that your CM knows how to disposition parts or devices that may subsequently fail.
If there is a clear and consistent problem, don’t hesitate to stop the line and review your processes so that you can save build materials to use on known good configurations. If the issue is happening sporadically or seemingly at random, then you may need to expand your search to earlier in the line or the supply chain and should consider if the percentage of failed parts will impede other aspects of your program such as software development or reliability testing.
Once an issue has been validated by the team, it should be migrated to bug tracking software if it isn’t already so that more detailed updates to the investigation can be added. Tracking numbers should be back-linked to the Spreadsheet tracker for a deeper review and so they can be reported on to other teams and leadership.
Pareto Charts
Another failure analysis tool to view issue data is through a Pareto chart – so named after the Pareto Principle which states that 80% of problems come from 20% of causes – and helps visualize issues by the quantity of failures that have occurred. This is one way to prioritize your failure analysis investigations because something that affects a large number of units is likely a consistent process or component level defect and solving that issue will reduce the quantity of failures by the greatest amount.
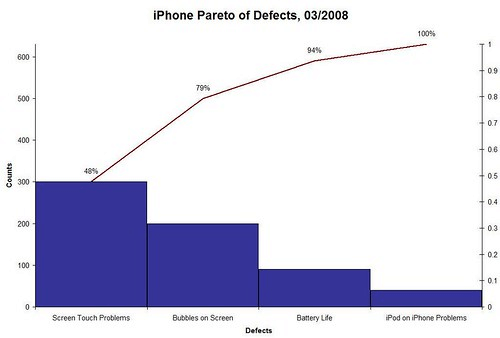
Credit: https://www.shmula.com/customer-service-an-iphone-case-study/476/
A word of caution: Sometimes multiple problems may stem from the same root cause and clustering can occur. This is where the cluster of issues may appear smaller because there are multiple symptoms and the root cause is not prioritized first. So before you tackle the biggest issues, look for patterns when starting your failure analysis process. Using a failure analysis tool like Instrumental’s Data Streams can help correlate different failure issues with product data and might even identify devices that present with different problems but have the same root cause. Learn how Lenovo used Instrumental pareto charts to reduce rework here.
Product and Test Data Failure Analysis Tools
Data from the line, especially data traceable by serial number, is crucial to any failure investigation. Knowing how a product looked during assembly or how it performed on a controlled line test can be a useful correlation to how it failed under harsh reliability or real-world conditions. Capturing this data and keeping it organized is a powerful tool for debugging issues.
The combination of product image data and test data in a failure analysis tool like Instrumental’s Data Streams makes it much easier to fight against failure. Failures at a functional test station can automatically be linked to image data from the same device to help your engineers look for a root cause. Multiple devices with the same problem can easily be compared against known good devices.
Slow motion video
The most destructive reliability tests tend to be mechanical tests where products are slammed against hard objects. The initial impulse of the impact is usually where the shock wave propagates from and slow motion video can help you observe it. Because these events typically happen in fractions of a second, slowing the picture down can help explain how the product ended up that way. Without video, you may get a drop tested device back with a failure and have little intuition about how the components behaved.
It used to be that slow motion video required an expensive camera and powerful lighting to capture drop tests or ball drops the instant they hit the floor. But now with inexpensive digital cameras capable of 960 frames per second and even mobile phones capable of 240 fps, you can get quick and easy videos of any drop situation with minimal investment.
Slow motion video also provides a real-world analogue to simulations. If you have very good correlation between your videos and your simulations, you can be confident in evaluating new designs through simulation before ever releasing changes or building updated products.
Action Camera Video
GoPro and other similar action cameras are failure analysis tools that can be added to almost any test to help capture the moment of failure in extreme situations or observe the change to the product over time through time-lapse videos. Much like slow motion video, watching how a device changes under testing is often a missing piece to understanding how a product fails.
Software Tools for Data Analysis
Using software like Excel, Matlab, Instrumental, JMP, and R, running Python Scripts can help you perform statistical analyses. Simple plots and regression lines can help you visualize data more easily and help you make sense of your data and more complex interactions can be modeled as well.
At the same time, you can also use these tools to process your supplier data and check your actual process variation and limits to further hone in your tolerance analyses and process capabilities. For instance if you measure 32 or more parts for some key dimensions, you may find variation when you plot your actual tolerances vs expected variation. Often certain processes might not fall neatly into a gaussian normal distribution but rather are skewed or bimodal.
Physical Inspection
If devices have been found to have failed on the line or after reliability, there is no better way to diagnose them than through physical inspections including teardowns, cross sectioning, and X-rays.
Teardowns
Teardowns can help you look for evidence of physical interference marks, and damaged components that can help tell the story of what may have happened.
Look for scratches and scuffs at impact sites, cracks in the material or broken and rattling pieces in your product. If you have captured product data during the build process, teardowns also can show you how the product changed from assembly to after disassembly indicating that some processes may need to change. For instance, cable routing in the SOP may have been specified and validated by your product data, but in reliability testing, something may have come loose and now the cable is interfering with antenna performance. If you tear down the product, you can see the difference between the inputs and the output.
However, once something is disassembled, it may be hard to determine how the failure occurred and you now have many more components to keep track of. I strongly recommend you document the teardowns using photos while also tracking the serial number and history of the device. Also be sure to keep the components together in a bag or tray, otherwise, the evidence may disappear in the chaos of cleanup, processes.
Cross-sectioning
A more destructive method of inspection that is useful in some cases is cross sectioning. A failed device is placed in a tray and a clear epoxy resin is poured over it. A vacuum is applied to allow the resin to seep into every nook and cranny so that your product is now completely solid. Once set, you can pick critical cross sections of the device to cut and polish.
With these cross sectioned areas, you can measure the actual physical gaps in the product compared to your nominal design and see how they correspond to your tolerance analyses.
Unfortunately, there are limits to this kind of investigation because batteries must be removed prior to assembly or you may cause a fire so you may have to partially tear apart the product to remove the battery before sectioning. Also the epoxy needs a pathway to enter into all the areas you want to cut through otherwise it may leave an air gap that can affect your final measurements of the cut areas.
X-Rays
X-ray imaging is a way to see through a product and get a sense of where your components are or to look for issues under a surface mounted IC that uses BGAs. The images are not always completely clear, but they can help you identify issues without having to disassemble your devices first.
Measurement Failure Analysis Tools
Measurement tools like a Coordinate Measuring Machine (CMM) or Optical Measurement Machine (OMM) are often critical to gathering data so understanding what they are and how to best use them is useful when specifying your measurement scheme in documentation and also when you are looking for additional data during failure analysis.
CMMs use a physical probe to touch components and compare locations. Different probe heads can be used to measure points in 3-D space. You can generate reference lines or planes to start your measurements using geometry. Because different measurement probes can be attached, you can sometimes measure at angles to get more accurate sizing for undercut features.
An OMM uses a camera to measure lines or features but this tends to flatten the image onto a 2-D plane. OMMs tend to be faster and easier to setup, but may be less accurate if you have more complex geometries on different planes.
Experiments
If you have isolated an issue and are looking to implement some solutions, you should find a way to test your hypotheses using prototype mockups, or a matrixed Design of Experiments or DOE.
Prototypes
Often physical prototypes need to be created from existing parts or machined samples in order to validate a design or assembly process solution. By mocking up the solution quickly and running controlled tests you should achieve a higher probability of success for your ultimate tooled solution. You may need to account for the difference in performance between modified or machined components compared to tooled parts as there are changes to performance when stress is introduced or relieved though secondary processes.
You can also use prototypes to test out individual feature changes without recreating the entire build or product. For example, you can create cheaper simplified test bucks that mate with the part you are modifying and focus on the performance of the component under investigation.
Just be careful that your test bucks accurately represent or stand in for your device, otherwise you may have introduced another variable into the system.
Design of Experiments (DOE)
If in your root cause analysis you find the possible solution set is too great to narrow down to one configuration, you may need to run a formal Design of Experiments. DOEs require you to identify potential factors to test and different levels within that test sample. Running a multi-factor experiment means you will generate a number of different configurations that when compared should help you identify how each factor contributes to the final performance of the product.
When building with more than just a few factors, these experiments can take a lot of time to prepare for and coordinate. They tend to show you trends of areas that will make the biggest difference, but the initial values are not necessarily the final options.
Here is a link to a more in-depth explanation of a DOE https://www.isixsigma.com/tools-templates/design-of-experiments-doe/design-experiments-%E2%90%93-primer/
Key Takeaways for Failure Analysis Tools
- Get a leg up on failures by doing preemptive analysis.
- Make sure to always document how and when failures occur so you can prioritize how to work on them
- When you can, take videos and photos of devices under test to find things you wouldn’t ordinarily be able to see.
- Know the available measurement tools and how they operate so you can make the best use of them.
- When you’re stuck, change some variables and see what has the biggest impact.
- Use processes to help you make decisions, but make sure the answers make sense.
- Tailor these failure analysis tools and methods to your projects.
Next Steps
We have discussed a number of different failure analysis tools and test methods that you can implement at your org. When something goes wrong it is often difficult to know where to start. Each of these tools is useful when done properly and at the right time in your program. Your job will be to figure out when to use them, how to set them up, and how to interpret your results to make the necessary changes to fix the problems.
In the next article of the series, we will dive into some critical questions to ask during Failure Analysis. We will also work through some examples of how the various failure analysis tools above were incorporated to solve issues on products you may have used!
Author
Related Topics