

Support / How do I find new defects with Instrumental?
Instrumental’s Discover AI automatically analyzes every image collected from your line to find interesting anomalies, and delivers results as a heatmap and list so you can quickly see where defects are occurring and prioritize investigation.
Discover AI makes it easy to sort through the most anomalous regions quickly and easily separate out critical defects from normal variation. Once you find a true defect, you can then create a Monitor to drive corrective action to fix the issue.
As you give the model feedback, Discover AI learns what types of anomalies are most relevant to you so you can spend less time looking through results, and more time solving problems.
This article describes how to complete this workflow in the Instrumental application.
Table of Contents
Start on the Discover Page
Navigate to the Discover tab in the main application navigation. The Discover page includes heatmaps of each station, and a ranked list of identified anomalies. Regions are ranked by the number of interesting results that they contain. This means, regions with the most number of interesting units appear first and regions with the least number of interesting units appear last.
Results are uploaded in near real-time as units pass through your assembly line; usually about 5-15 minutes after an image has been taken.
Explore potential issues
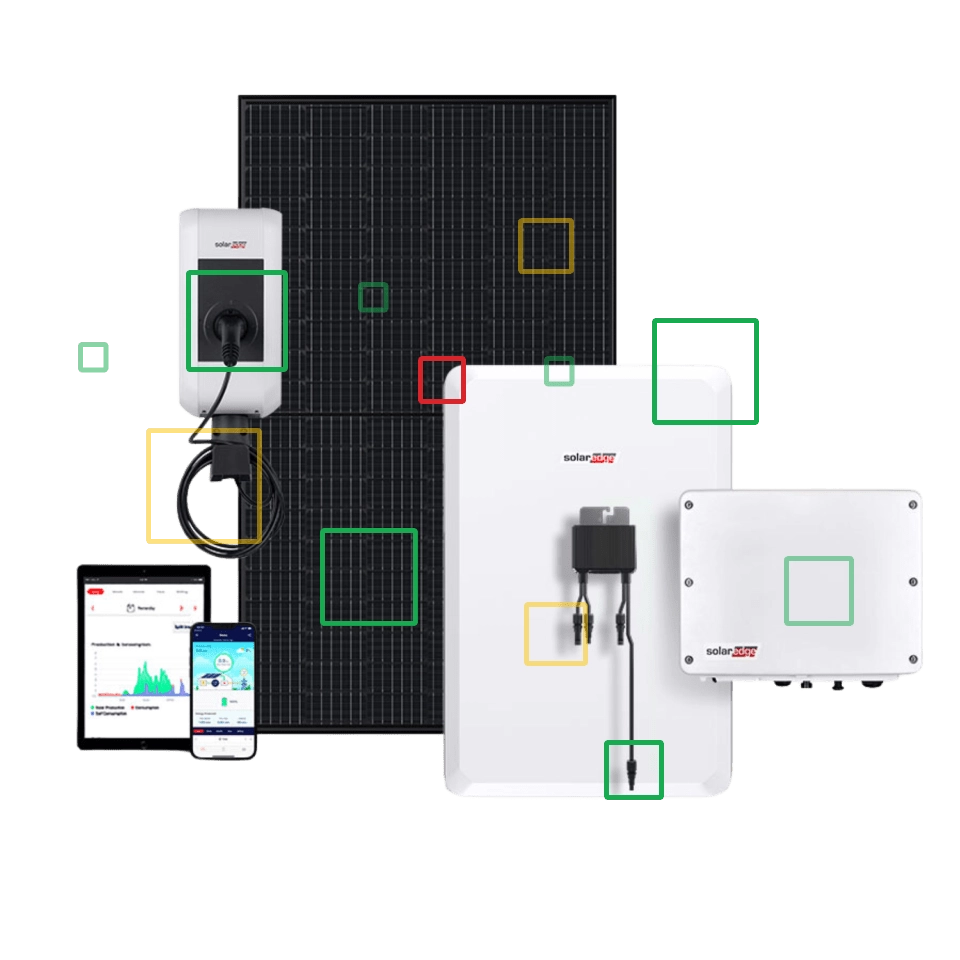
Heatmaps make it easy for you to quickly see every region highlighted by the Discover model, and drill down on anomalies within each region. Heatmaps are colored according to what kind of results the system has highlighted. Regions in red contain at least one Interesting result. Regions in green contain only Normal results.
Clicking on a color-coded region or dragging over a group of regions will take you directly to the chosen region(s).
You can use the calendar icon and the ‘Add unit filter’ in the top left hand corner to further limit the units inspections you’d like to see anomalies for:

Below the heatmap is the list of regions where the Discover model has identified potential issues. Each region can be expanded to highlight more examples of interesting or normal units.
To get more context on why a result may be predicted as interesting, you can:
- Zoom out to see the area around the selected region
- Highlight differences using a purple overlay to clearly see differences,
- Get context to understand where that region is located on the larger image of your product.
Interpreting and Improving Discover Results
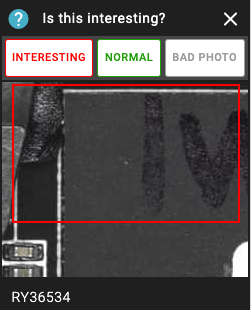
Discover results are separated into three groups: “Interesting”, “Normal”, and “Bad Photo”. Discover AI will automatically categorize each image into one of these groups, and sort them within the group by how anomalous it believes it to be.
- Results labeled “Interesting” are things that the Discover AI model has predicted to be anomalous.
- Results labeled “Normal” are things that the Discover AI model has predicted as typical for that region.
User Labeling
Users can improve the model’s future predictions by correcting the label given to each image crop on the Discover page. Simply hover over a crop to display the labeling interface, and select the label that should have applied to the crop.
Interesting – Crops labeled ‘Interesting’ are used to train the model on what it should show users moving forward. Think “I would want to see more anomalies like this, if they occur in the future.”
Normal – Crops labeled ‘Normal’ are used to train the model to ignore images like it in the future. Think, “This is normal variation, please don’t tell me about images like this in the future.”
Bad Photo – When a crop isn’t ‘Normal’, but it’s because of an issue with the photo (an operators hand is in the frame, etc), you may not want the model to learn that images like it are ‘Normal’, but you also don’t want them labeled as ‘Interesting’. ‘Bad Photo’ removes the crop from the ‘Interesting’ section, but does not cause the model to learn it is ‘Normal’.
Users can view the labeling interaction by hovering over the crop card within the Discover region.
If you don’t know what to label a crop you can leave it unlabeled. Discover AI’s model will still automatically learn from every unit it sees, refining and updating the model’s understanding of what is ‘Normal’.
If you incorrectly label a crop, you can correct it by simply labeling it again. You can see an image’s label history by clicking on the small clock icon on the top right hand side of each Discover result.
You can filter the results shown to only those with or without user labels using the “Confirmed” and “Unconfirmed” filters at the top of the page.
Model Improvement Over Time
The Discover AI model improves over time by looking at both user labels and unlabeled normal units in order to establish what is anomalous and interesting within each region’s population of images.
Typically, the model begins to see significantly better performance on a region of the image after around 10 user labels, especially if those labels “correct” the model’s initial categorization. For example, if Discover AI predicts an image crop is “Interesting”, but you disagree and label it “Normal”, it will have more of an impact than confirming the “Interesting” label.
Filters on the Discover Page
You can filter results on the Discover page based on date, label status, region status, and SKU.
To filter to results from only a specific date, click on the calendar icon in the top left hand corner. You can select one day, or up to 30 consecutive days.
To filter results shown based on label status, you can use the Region Filters alongside the heatmaps at the top of the page.
To see regions where no labels have been applied during the selected time period, select “View New”; this will display regions where all results are either “Unconfirmed Interesting” or “Unconfirmed Normal”.
To review regions that have had labels applied, select “View Seen Regions”. This will display all regions where a label has been applied ot at least one result within that region during the time period chosen. You can further filter results to only display a subset of those user confirmed labels; Interesting, Normal, or Bad Photo.
You can review all regions, regardless of Label status, simply click on “View All”. This will display all regions, and order the page based on the number of Interesting results per region. 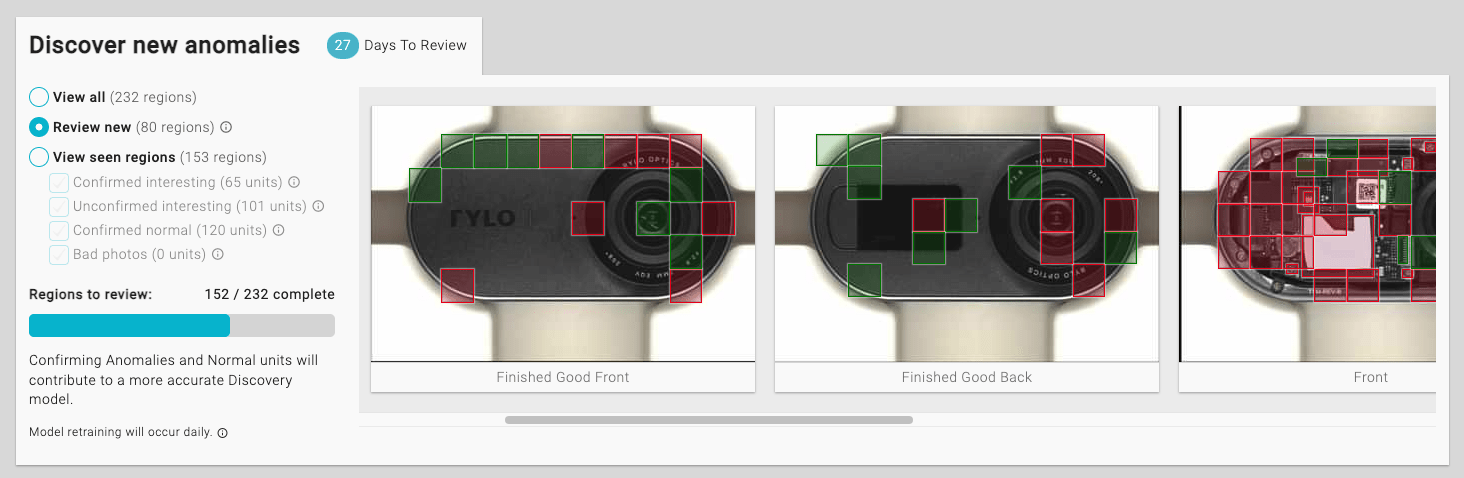
You can also use the units page to only showcase results associated with specific unit properties by using the Unit filter at the top of the page. This is especially useful for customers that have multiple different SKU’s configured in the Instrumental application.
Monitor True Defects
Once you have found a defect using Discover AI, you can track how often it occurs using Instrumental’s Monitor feature. Simply label a defect you want to track as “Interesting”, and a button will appear to “Monitor This”. Click that button, and the Instrumental system will perform a similarity search to find other units that have the same type of defect.
Then, you can follow the standard Monitor Workflow to track how common the issue is over time.