

Support / How do I monitor an ongoing issue or defect that I have identified?
Instrumental Monitors allow you to easily train your own AIs to test for specific defects on your units, or to find other important visual characteristics. This is useful when diagnosing, correcting, and enforcing quality:
- Retroactively find units built to date with the defect, to aid failure analysis
- Intercept units live on the line for in-place investigation and rework
- Monitor the defect rate over time to evaluate the impact of corrective actions
Each Monitor you create runs in the cloud by default, allowing you to safely review results without impacting your build. If you decide to use the Monitor to notify line operators of passes or failures, you can turn the monitor “Live” at any point.
To learn more about the recent changes to Monitors please see: Changes to “Monitors”: Summer 2024
Table of Contents
Creating a Monitor
There are three ways to create a monitor:
1. Create a Monitor from Discover
The first starts on the Discover page. If Discover AI finds a defect you may want to track that defect systematically. To do so, confirm the image is “Interesting” and then you can click the “Monitor This” button that appears. To learn more please see How do I find new defects with Instrumental?
2. Create a Monitor from an AI Search
The second starts on the Units page, with an AI search. When investigating a component or region for defects Instrumental AI search is a powerful tool, as you can search for all units with anomalies in a particular region. Once you’ve found a defect you can search for all units that look similar in the defective region.
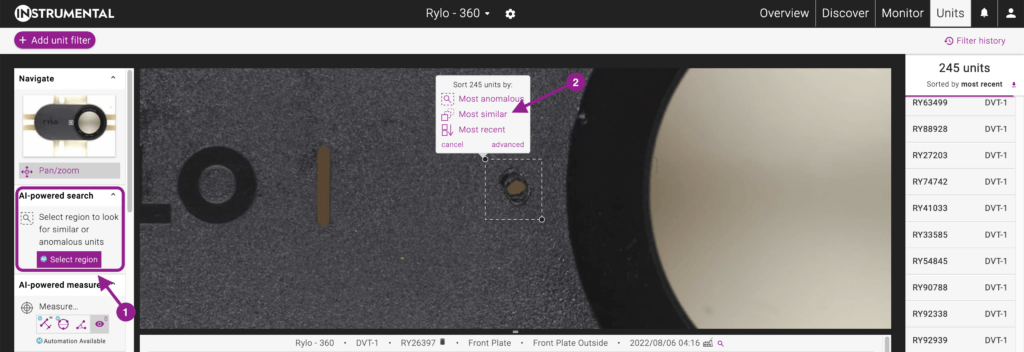
- On the Units page click ‘Select region’ (1) on the left menu under ‘AI-powered search‘.
- Draw a box around the component or issue of interest.
- If you’ve drawn a box around an example of the defect (as pictured above) you can click ‘Most similar’ (2) to search the last 500 – 5,000 units for similar defects.
- If you don’t have an example of the defect selected, but are interested in finding defects in the region, you should first click ‘Most anomalous‘ from the tooltip to find potential defects in the last 500 – 5,000 units.
- Once you find an example of the defect on the anomalous search screen you can select the ‘More like this’ button to re-sort units on similarity to the defect type of interest.
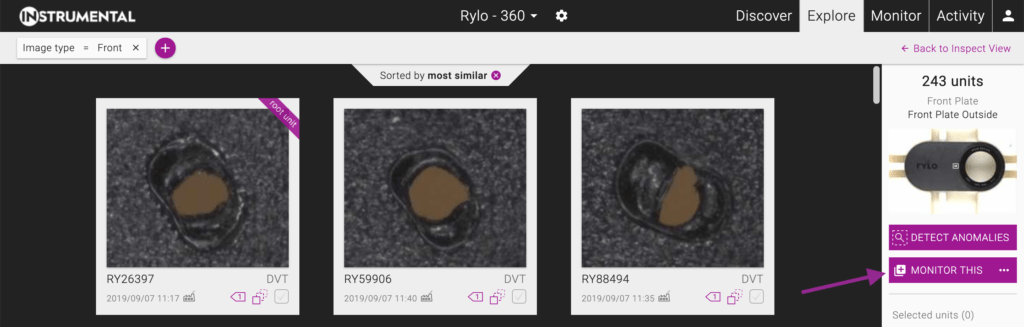
- Once you run a similarity search Instrumental’s AI will sort units based on their similarity to example of the defect.
Tip #1: If you don’t see examples of the defect in the initial search, use ‘analyze more…‘ to search beyond the last 500 units:
Tip #2: Draw your region carefully. Try to completely include the defect, but don’t include nearby areas with potential visual noise (e.g. moving components or areas prone to lighting differences). Monitor AIs learn from everything in the selected region, so it is possible it may learn to look for unrelated variation if in the region drawn.

Once you have examples of the defect mode you can train a Monitor AI to automatically detect that defect across all units. Click ‘Monitor this‘ on the right panel:
This will put you in a training mode for the Monitor AI. To train a monitor you need to give the monitor examples of units which should ‘Fail’ or ‘Pass’ the monitor you’re creating by clicking the respective buttons under each thumbnail (1):
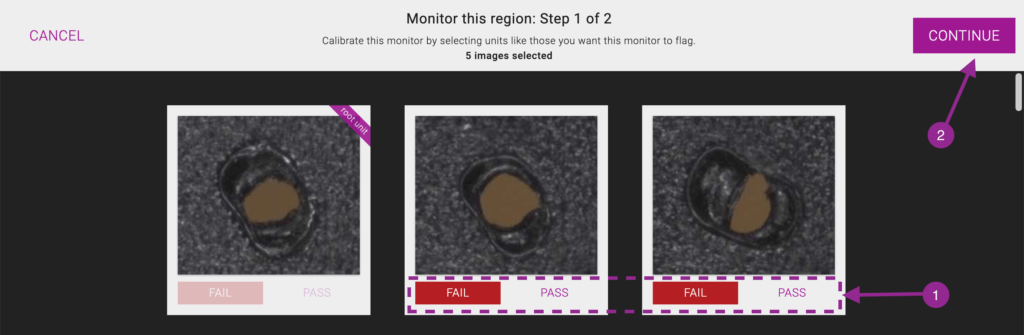
Tip #3: While a monitor can work with as little as 1 example of a ‘Failing’ unit, performance improves with more ‘Fail’ examples. For the best performance please try to find at least 4 examples of ‘Failing’ units. If you don’t have 4+ examples of “Failing” units right now don’t worry – you can easily label new units in the future, as the defect reoccurs. A monitor also requires at least 2 ‘Passing’ examples, with 30+ examples of ‘Passing’ units recommended for improved performance.
Once you are done labeling the pass/fail units, click ‘Continue’ (2) to be taken to the Monitor creation modal.
3. Create a Monitor from a Known List of Serial Numbers with the Defect
If you have a list of units with a known defect you can use those units to train a new Monitor from the Units page.
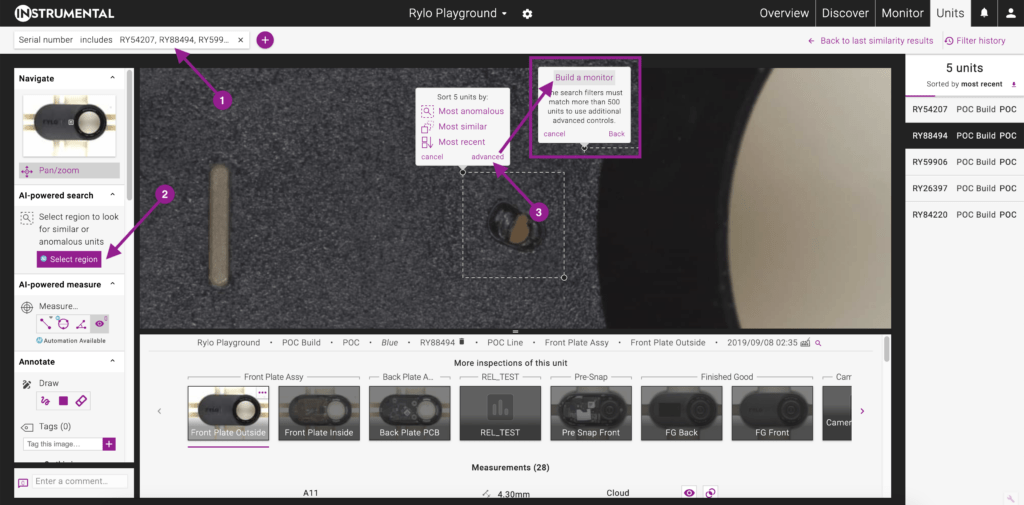
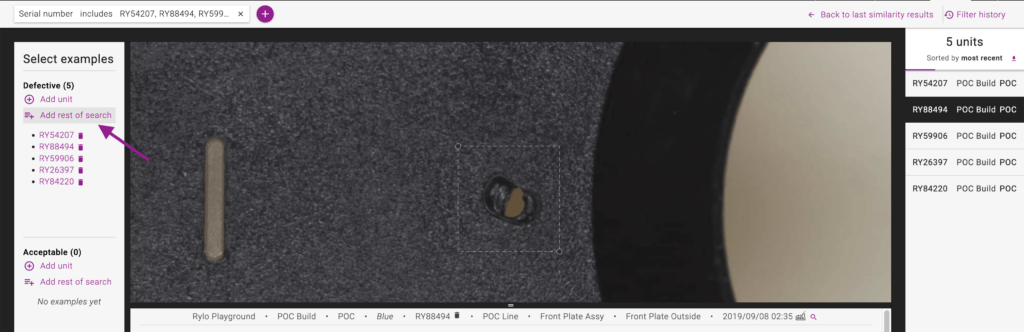
- Search for the list of serial numbers with the defect using the “+ Add unit filter” (1) in the upper left. Select ‘Serial number’ and ‘includes’. You can then enter the list of serial numbers as a comma separated list.
- Click ‘Select region’ (2) on the left menu under ‘AI-powered search‘.
- Draw a box around the defect. In the menu that pops up select ‘advanced‘ (3), and then ‘Build a monitor‘.
- The left hand menu will change to allow you to specify the specific defective (“Fail”) and acceptable (“Pass”) example units to train this monitor. To specify all of the defective units you already filtered on in step #1 simply click ‘Add rest of search‘ under the ‘Defective‘ header.
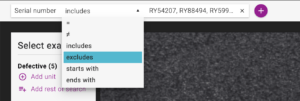
- Now you need to specify the acceptable (“Pass”) example units. Change the unit filter from ‘includes’ to ‘excludes’ to select all the units that are not on the list of defective units, then hit ‘enter’ twice to apply the new filter:
- Now you have two options for specifying “Pass” examples. If you are reasonably confident there are not other recent defective units you can once again click ‘Add rest of search‘ under the ‘Acceptable‘ header to add all recent units outside of the supplied list of serial numbers as examples of passing. However, if you are not confident you can manually review and add units individually. Clicking ‘+ Add unit‘ (1) will add the specific unit you’re currently viewing as a “Pass” example. You can use the up/down arrow key to quickly scroll through the list of possibly passing units, adding each individually if it looks good. For the best performance please have at least 30 “Passing” examples.
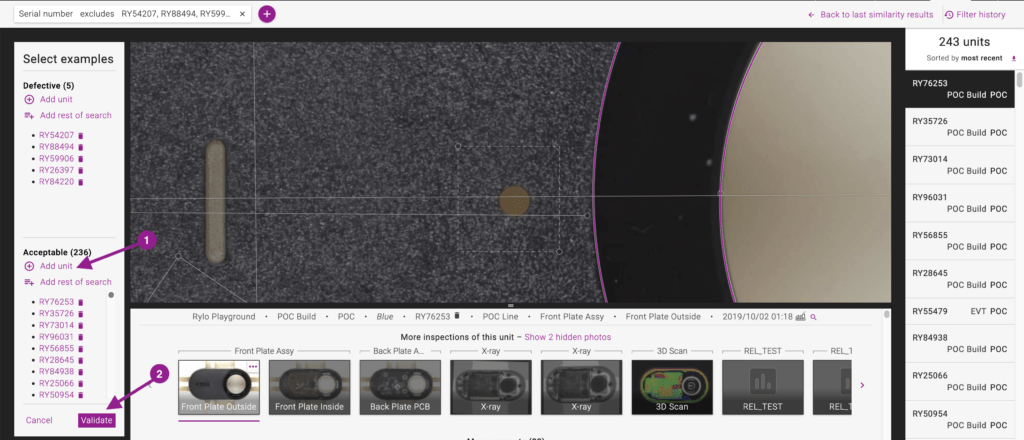
- Once you have added all the units you’d like to train the monitor, click ‘Validate’ (2) to bring up the Monitor creation modal.
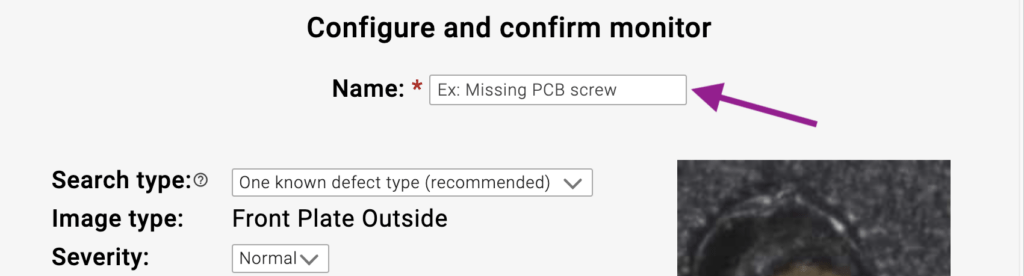
Monitor Creation Modal
This is where you can specify a monitor’s initial settings. The only option you need to specify is the monitor’s name, after which you can click ‘Save‘ unless you want to use the advanced options.
Advanced Options
Search Type
You should typically leave the default option, “One known defect type”, which will attempt to find units with the same defect as the units you’ve labeled “Fail”.
The other option “Unknown or irregular defects” will find any anomaly at least as severe as the units you’ve labeled “Fail”, which can be very noisy (many false positives). In most cases using Discover AI is the better option for finding new defects.
Handle Multiple Unit Configurations
Sometimes you may be running multiple configurations on your line (for example, if you’re making multiple colors, or if some units have different components than others). In this case you may see a “Filters” option in the modal.
If the monitor is looking at a region that is visually different across the configurations, you may want to limit the monitor to only look at visually similar configurations, as it may identify false positives if it looks at units which are different in the region.

Evaluate Units Since
By default a new monitor will retroactively evaluate up to the last 10,000 units to see if they have the defect being monitored. If you need the monitor to evaluate more (or fewer) units you can change the “Evaluate Units Since” date to retroactively evaluate up to the last 100,000 units.

Allow my team to view flagged units
If you are creating a monitor for an investigation you are running, but don’t believe anyone else on your team will need the data, you can set the monitor to be ‘private’ so that it will only be visible to you (you can always change this setting later).
To do so deselect the ‘Allow my team to view flagged units’ checkbox at the bottom of the modal.
Viewing the Monitor You’ve Created
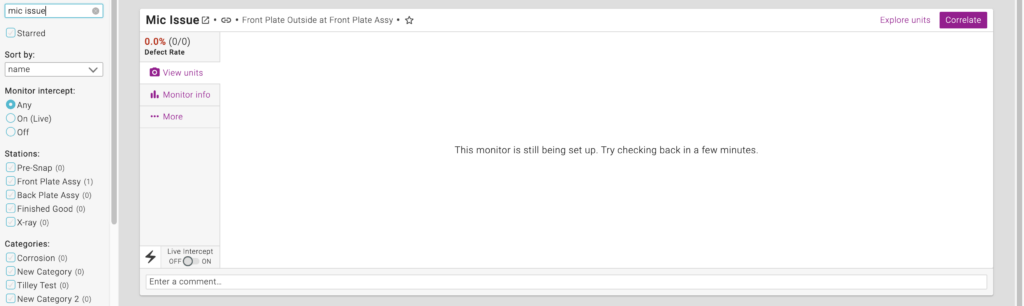
Once you’ve set up the Monitor, you will get a prompt allowing you to navigate directly to the new monitor immediately or you can choose to stay on your current page, while the new Monitor AI trains in the background. Training a new monitor usually takes a few minutes, though it can occasionally take longer, depending on how many units you have asked it to retroactively review. If the monitor you’re looking at is training please wait a few minutes and refresh the page.
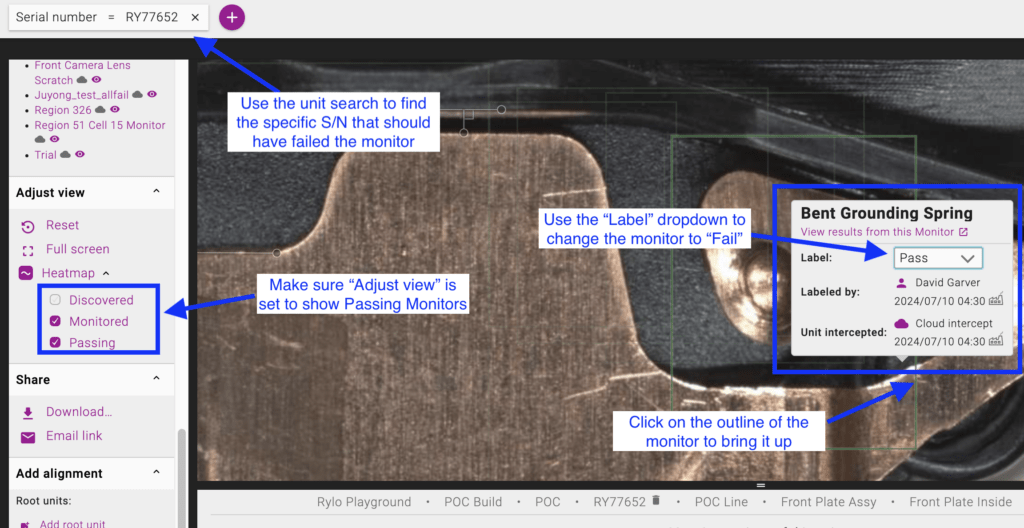
To find your monitor later, go to the Monitor page and search for its name in the left sidebar, or use the Heatmap at the top of the page to find the monitor by location.
Intercepting Live on the Line
If your monitor runs successfully for awhile in the cloud, you may want to promote it to run as a live Pass/Fail test directly on your assembly lines.
When a Monitor is “Live” the station will alert operators through a stack light and station UI warnings each time this issue occurs so they can take corrective action. Live Monitors require an Instrumental Station or In-Factory Server.
Managing a Monitor
Top-level Actions
The layout for individual monitors has been designed to make the most important information and actions more prominent:
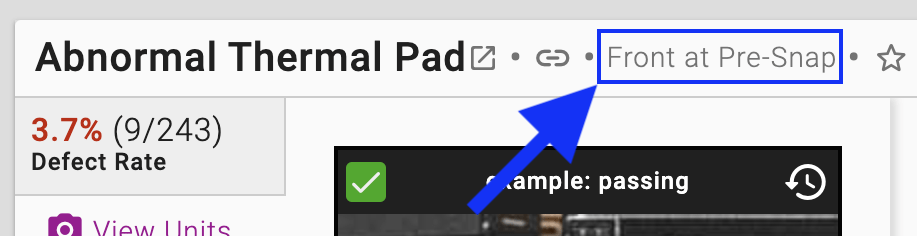 | Inspection Run On: Each monitor’s top bar now contains information which station inspection it is run on, and the specific configs (e.g. SKUs) it is restricted to, if applicable. |
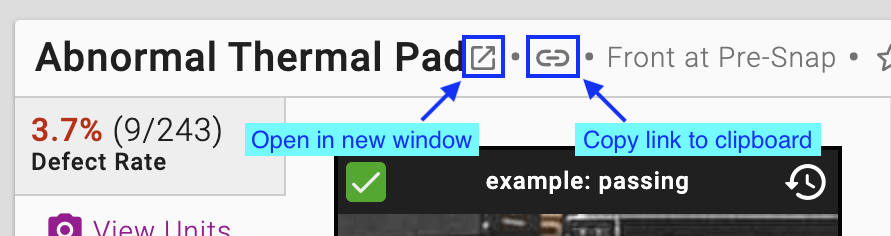 | Direct Link to a Monitor: Each monitor has its own page, which can be accessed by clicking on that monitor’s name or the ‘open’ icon next to it, to open a new tab for that monitor. Alternatively, you can click the link icon to copy the monitor’s URL to your clipboard. |
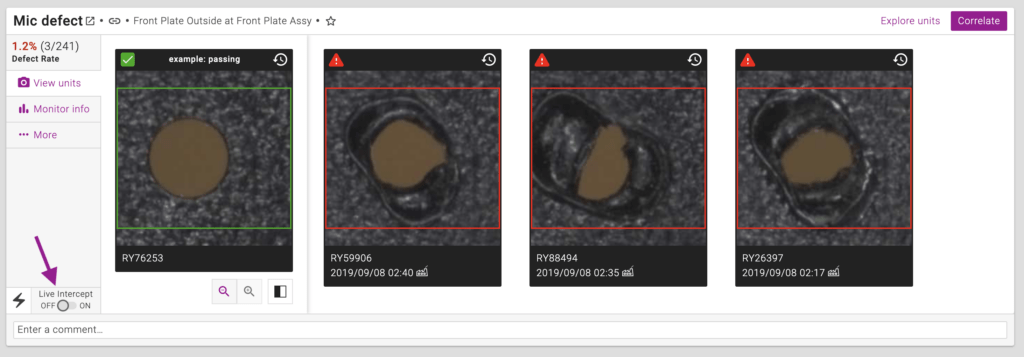
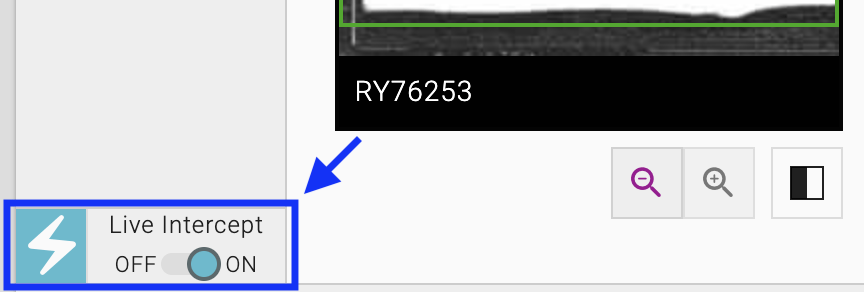 | Live Intercept Toggle: Setting a monitor to intercept units live on your manufacturing line, showing the operators an ‘OK’ or ‘NG’ assessment so they can investigate and/or rework units. |
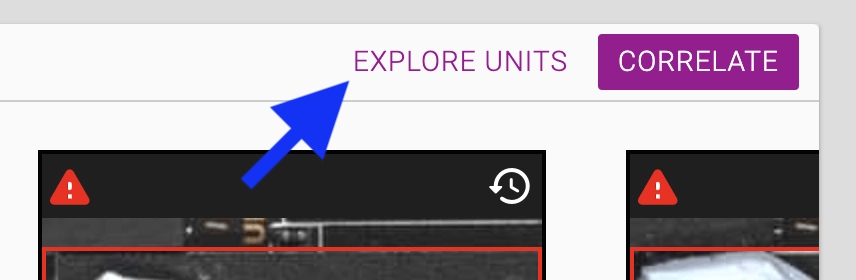 | Explore Units: This will bring you to the Units page, filtered to all units that flagged this monitor. From there you can download the S/Ns and other inspection data for those units, apply additional unit filters to further narrow the units you’re looking at, or switch to the ‘inspect’ view to view additional assembly images for the flagged units. |
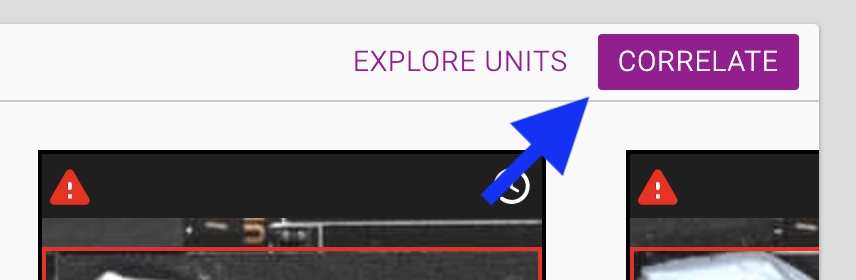 | Correlate: The ‘Correlate’ action will take you to the Correlations page with this monitor’s pass/fail selected as your root metric, making it easy to find the strongest relationships between this defect and your other unit data (test data, etc). Note: You must have the Solve AI license to use the Correlations feature. |
Tabbed View
The monitor view has been further broken up into three tabs:
- “View Units“: This view is optimized for reviewing recent results, with tools to investigate images of units that have recently ‘failed’ this monitor.
- “Monitor Info“: This view is optimized for managing the monitor, including a chart of the defect rate over time and basic monitor characteristics.
- “More“: The More menu is where you can find advanced actions, which are only needed in specific circumstance.
Re-labeling Monitor Results
Monitors AIs learn from examples of “Passing” and “Failing” units. By labeling units in the initial training you help the AI learns the visual characteristics of a “Pass” or “Fail”, so that it can sort other units into those categories.
However, the monitor AI is only as good as its training examples. When it encounters new units that present differently from previous examples it may occasionally make the wrong call – it may “Fail” a normal unit (false positive), or “Pass” a defective unit (false negative).
This indicates the Monitor needs to learn through additional training. When you correct a Monitor’s mistake you not only fix the Pass/Fail for that one unit, you teach the model to be more accurate in the future.
Identifying False Positives
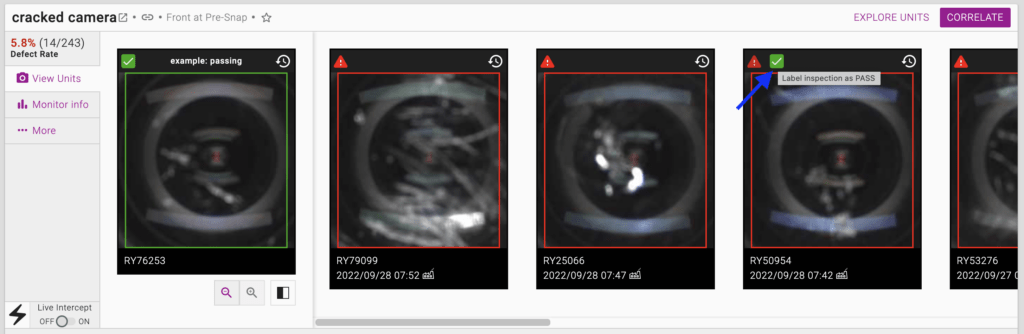
If you spot an instance where you believe a unit has been incorrectly “Failed” by a monitor (a false positive) you can re-label the unit as a “Pass”. To do so simply mouse over any monitor image that should not have failed and select the checkmark icon at the top.
Relabeling an inspection will:
- Change the result for that monitor on that inspection to “PASS”. This will be reflected in statistics shown throughout Instrumental (defect rate, etc).
- Record the change in the Label History and Changelog. You can always use the Changelog to audit the initial label and most recent re-label on a monitor.
- Automatically schedule a retraining for the AI, to incorporate the new label. Typically the monitor will retrain within 15 – 45 minutes.
If you do not want the retrained model to automatically take effect, you can require user confirmation. See “Controlling Monitor AI Retraining” below.
Identifying False Negatives
If you become aware of a unit that “Passed” when it should have “Failed” you can re-label it on the Unit page:
“Tune” Your Monitors for Better Performance
If you’d like to improve a monitor’s performance, but aren’t aware of specific examples of false negatives or false positives to relabel, you can use the ‘Tuning’ interface.
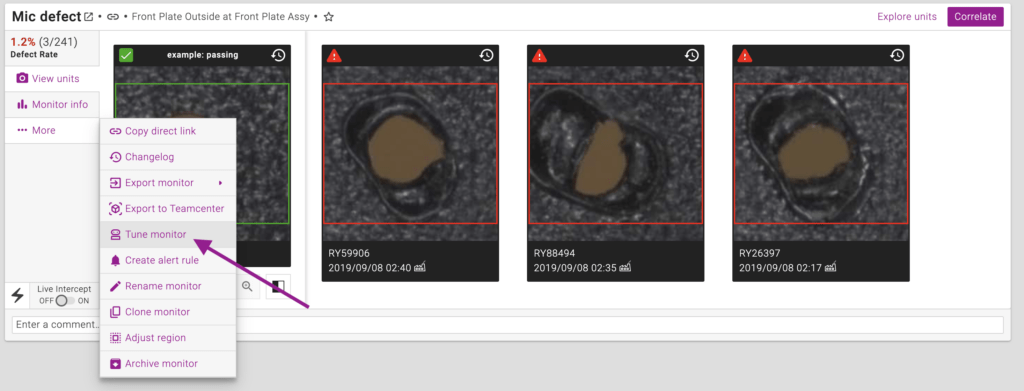
To tune a monitor select ‘Tune monitor‘ monitor under the ‘More‘ dropdown. (Please note that your user must have the appropriate permission to see this option.)
Provide More Labels
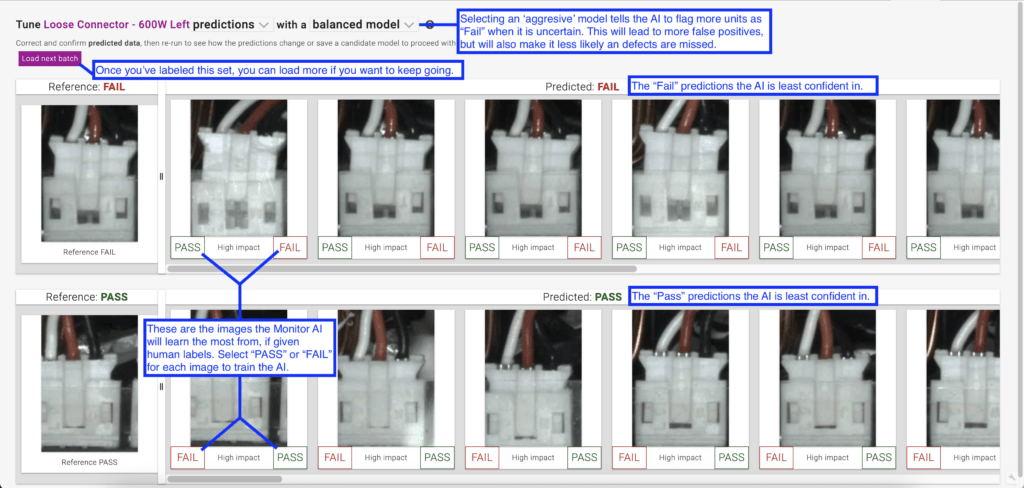
Monitor AIs learn from all human labels. However, the AI learns the most when human labels are provided for units it is uncertain about, as it allows the model to learn the subtle differences between a “Pass” and “Fail”. The Tuning page therefore displays the “Fail” and “Pass” labels the AI is least confident in for human labeling:
Select Model Aggressiveness
Every Monitor AI needs to strike a balance between missing defects (false negatives) and being ‘noisy’ (false positives). By default monitor try to strike a balance, minimize the number of false positives, while still trying to catch most defects. However in some cases you may prefer a monitor to catch more possibly defective units, even if it significantly increases false positives.
You can use the second dropdown to select between the default ‘balanced model’ and the optional ‘aggressive model’.
Review Existing Human Labels
Monitor AIs learn from human labels. If any units are incorrectly labeled by a user it may cause the monitor to become ‘confused’ as it learns that some aspects of the defect are normal, or some aspects of normal units are part of the defect. This can cause significant performance issues.
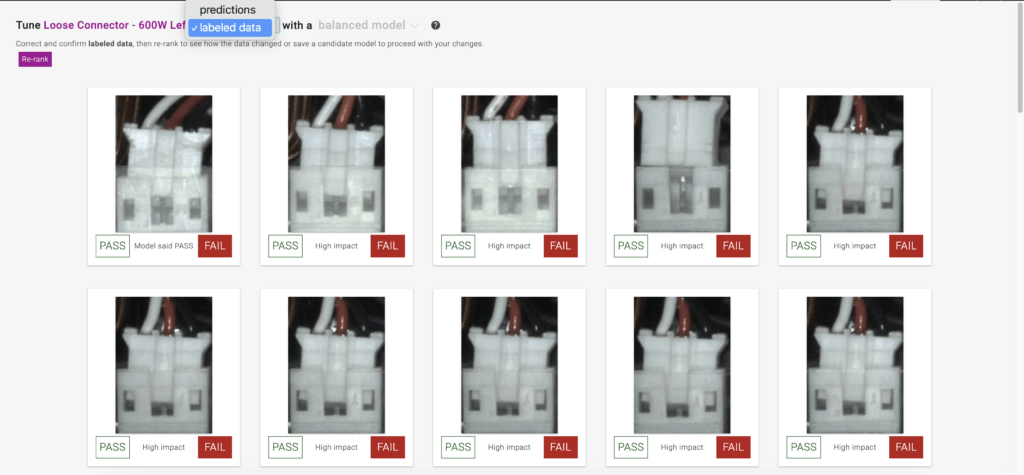
If you are seeing performance issues you may want to review the existing human labels. On the tuning page you can select ‘labeled data’ from the first dropdown to see all existing labels, and if necessary, correct them:
Controlling Monitor AI Retraining
AI Automation Settings: There is a new project settings section called “AI Automation Settings”. You can navigate to it directly by going to the “Project Settings” screen, or use the link to it which shows up in the “Train new AI model” badge, which appears after re-labeling an inspection.
By default this will be set to “Automatic“. The retrained monitors will immediately be used for all new inspections, once the retraining is complete. It will not be applied to previous inspections. Please note: for “Live” monitors to take effect in the factory, there needs to be an active internet connection to the station. If there is not, the retrained monitor will take effect the next time the station is connected to the internet.
If the setting is changed to “Manual” then a user will have confirm each individual monitor update before the retrained model will take effect. Users will see a “New AI model available” badge on a monitor once the retraining is complete. Click “Apply model” to have the new model take effect:
![]()
Permissions: There are two user permissions which control whether a user can:
- Change monitor results by relabeling
- Approve new models (if required — see ‘AI Automation Settings’ above).
If you would like to change your permission, or the permissions for other users, please reach out to your Instrumental representative.