Support / How do I track and improve my product’s yield and output?
Instrumental’s ‘Overview’ dashboard helps you to track the overall health of your program:
- Maintain oversight of your KPIs, at both the program and station level: First Pass Yield, Final Yield, Output, Units per Hour.
- Analyze your KPIs, using the Unit Filter to drill down to specific units populations (i.e. review KPIs by config, by line, by supplier, by test result, etc).
- Surface negative yield hitters to kick off investigations, with one-click drill-downs to station Paretos and correlations.
Please note that all KPIs shown are based on the best available data Instrumental has. If you have Pass/Fail tests results that are not uploaded to Instrumental, the calculated KPIs may overstate the actual yield of your program.
Table of Contents
Navigating to the Overview Dashboard
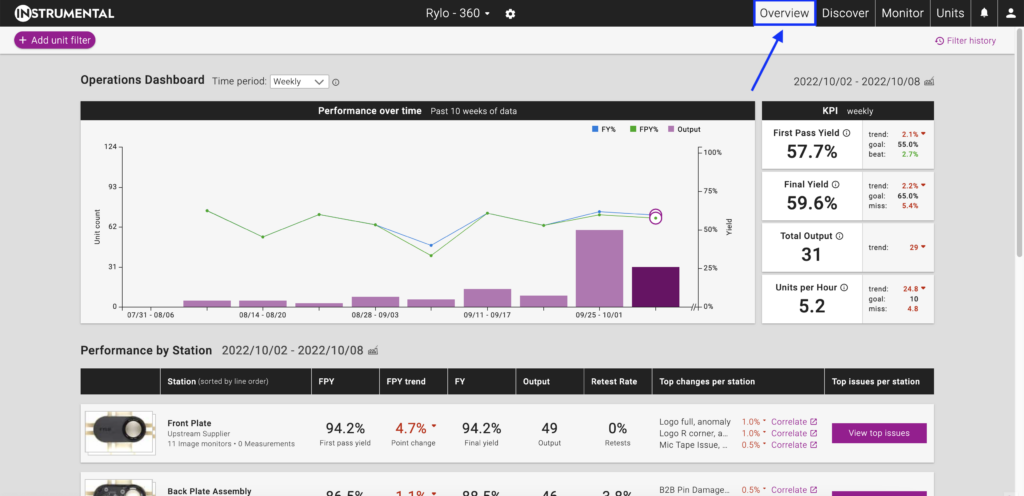
To access the Overview dashboard you can select it from the top navigation:

Overall Performance
The first section displays the overall performance of your project on KPIs, including First Pass Yield, Final Yield, Output, and Units per Hour.
It is comprised of a chart showing performance trends over time, and a table of the overall KPIs for the latest (or selected) period.
Performance Over Time
The “Performance over time” chart shows overall KPI trends for the program, aggregated across all stations, over the last 10 periods. The KPIs displayed are First Pass Yield (green line), Final Yield (blue line), and Output (purple columns). Mousing over a column will show the KPIs for that specific period. Clicking a column will filter the rest of the dashboard to that period.

The left Y-axis shows the count of units based on Output, and right Y-axis shows a % Yield.
Overall KPIs
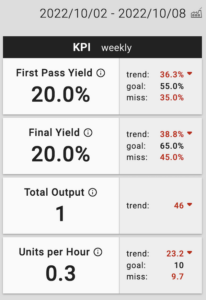
| Next to the “Performance over time” chart is the overall “KPI” table, which shows overall KPIs for the project, aggregated across all stations, scoped to one selected period.
The KPIs displayed are overall First Pass Yield, Final Yield, Output, and Units per Hour. The right column to helps to contextualize the KPIs, by providing:
|
 |
Selecting the Time Period
The “Performance over time” chart shows the last 10 periods in which there was an active build (at least one inspection result), by default.
The “Overall KPI” and “Performance by station” tables shows data for one selected period, by default the most recent period shown on the chart. Clicking any column on the chart will select that time period and apply it as a filter for the rest of the dashboard.
The “Time period” dropdown above the “Performance over time” chart to select the timeperiod split shown in the chart (Hourly, Daily, Weekly, Monthly, or Quarterly).

If you would like to see a prior period (before the most recent 10 periods) you can apply a “Date seen before” filter using the Unit Filter at the top of the page:

Filtering results
The data on the Overview dashboard can be filtered using Unit filters. Unit filters are a powerful tool for segmenting the data on any unit attribute captured within Instrumental. You can filter your KPIs by SKUs or configuration, by build, by line, or by the value of any inspection or test result.
Please note: The “Add unit filter“ filters units, not inspections. All the data (inspections) for units that match the filter will show up on the page. This will include inspections for those units on other stations, as well as inspections those units had on other dates. You should treat the “Add unit filter” as a way to isolate a population of units, not specific inspections.
For example, this would select all units inspected on the “Back Plate Assembly” station on 9/28:

The Overview dashboard KPI will reflect all the available data for those units, including inspections on stations other than “Back Plate Assembly”, and re-inspections on “Back Plate Assembly” that fall on other dates, as long as one “Back Plate Assembly” inspection was on 9/28.
Station Performance
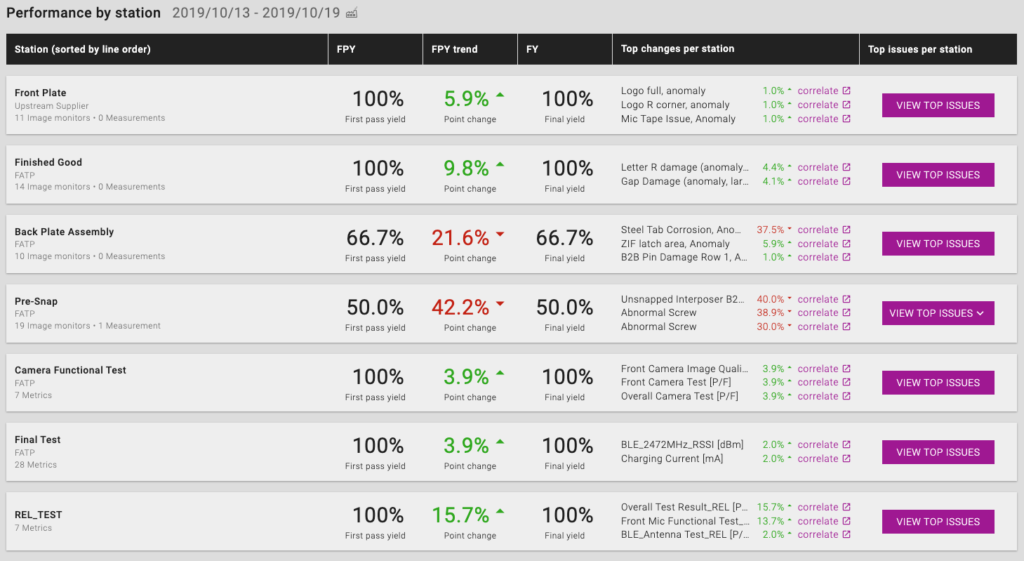
The Performance by station table makes it easy to find the source of Output & Yield problems. Stations are listed in their line order (configurable in Project Settings).
The “FPY trend” and “Top change per station” columns compare the performance of the station, and individual tests on that station, in the current period vs. the prior period. The “Top change per station” column will specifically show the tests with the greatest change period-over-period:

To dive deeper into why a station’s performance may have changed you can:
- View all the tests for that station, ranked by their defect rates. Clicking the “View Top Issues” button to navigate to the Metrics screen, filtered on the station.
- Quickly correlate a test with a significant change in defect to all other unit data, as well as Instrumental AI results (Monitors, Measurements, Discoveries) by clicking on the correlate link next to one of the tests in the “Top changes per station” column.
KPI Calculations
Instrumental provides KPIs that are essential to understanding the health of your program: First Pass Yield, Final Yield, Output, and Units per Hour.
Please note:
- The KPIs shown are scoped to a given time period, which can be changed by selecting data on the Performance over time chart.
- KPIs are calculated at both the Station level and the Project level. See the individual KPI definitions below for details on the calculation.
- These metrics are calculated using the data available within Instrumental. If you have additional test data which has not been uploaded into Instrumental, or if spec limits have not been provided for your parametric test data, the KPIs shown in Instrumental will not include the impact of those tests.
Different companies calculate each of these metrics in different ways. Instrumental provides two options for calculating your KPIs, given re-inspections:
| Option 1: Group data on ‘output’ inspection date | Option 2: Treat inspections independently |
|---|---|
| If the dashboard uses the “Group data on ‘output’ inspection date ” calculation approach, a unit will count towards a station’s KPIs at a single point in time.
Specifically, when the unit was ‘outputted’, i.e. the final re-inspection date, from that station or from the line, for station and program level KPIs respectively. If the first inspection at a station was on an earlier date to the final inspection, its P/F impact on FPY will only be reflected on final inspection date. |
If your dashboard is using the “Treat inspections independently” calculation approach, each inspection will be treated independently:
This means that a single unit can count towards the FPY and FY of a single station on separate dates. |
Please speak with your Instrumental representative if you have a preference for which option you would like used for your line.
First Pass Yield (FPY)
First Pass Yield is a popular measure of process quality and productivity. It looks at the percentage of parts that pass each inspection the first time they are inspected. This is important as addressing a failed inspection often requires additional time, labor, and/or destructive tear-downs to rework and reinspect the part.
Station Level Calculation of FPY
First Pass Yield (FPY) for each station is calculated by dividing:
(# of units that passed on their first inspection in that period) / (# of units with first inspections in that period)
As mentioned above, if your dashboard is using the “Group data on ‘output’ inspection date” calculation approach, a unit’s first pass yield will be reflected on the date the unit was ‘outputted’ from the station, i.e. the final (re-)inspection date on that station. If your dashboard is using the “Treat inspections independently” calculation approach, a unit’s first pass yield will be reflected on the date of the unit’s first inspection at that station, regardless of when it is outputted.
Project Level Calculation of FPY
If your dashboard is using the “Group data on ‘output’ inspection date” calculation approach, a program’s first pass yield will be calculated by looking at all the units that are ‘outputted’ from the line, i.e. have the final (re-)inspection for that unit. The FPY will be the percentage of those units that passed their first inspection at each station.
If your dashboard is using the “Treat inspections independently” calculation approach, Overall First Pass Yield (FPY) is calculated by multiplying station FPY within the specified time period, as this reflects the theoretical FPY of a group of units that passed through every station on the line in the given period.
Final Yield (FY)
Final Yield is a popular measure of process quality. It looks at the percentage of parts that pass each inspection the final time they are inspected. This is considered important as it directly translates to the output of the line. Each part which does not eventually pass all inspections becomes yield-loss, reducing output and raising cost.
Station Level Calculation of FY
Final Yield (FPY) for each station is calculated by dividing:
(# of units that passed on their final inspection in that period) / (# of units with final inspections in that period)
Warning: Instrumental does not know for sure than an inspection is “Final”. It is always possible that a re-inspection will be uploaded in the future for any given unit at any given station. Therefore Instrumental always assumes the last inspection in Instrumental (for a given station) is the “Final” inspection, which drives both the FY and Output KPIs.
If a new re-inspection comes in for a unit, the previous inspection is no longer treated as “Final”, which can cause FY (and Output) to change retroactively.
Project Level Calculation of FY
If your dashboard is using the “Group data on ‘output’ inspection date” calculation approach, a program’s final yield will be calculated by looking at all the units that are ‘outputted’ from the line, i.e. have the final (re-)inspection for that unit. The FY will be the percentage of those units that passed their final inspection at each station.
If your dashboard is using the “Treat inspections independently” calculation approach, Overall Final Yield (FPY) is calculated by multiplying station FY within the specified time period, as this reflects the theoretical FY of a group of units that passed through every station on the line in the given period.
Output
Output is a popular measure of productivity, as it looks at the total number of parts / units produced at a given station or line in a period of time. Operations teams frequently forecast and set specific Output targets for their line.
Output is the total number of units that passed all tests at the last inspection at each station that has inspected them so far.
Units Per Hour (UPH)
Units Per Hour is the total Output divided by the number of hours during which at least one inspection occurred.
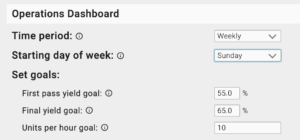
Project Settings – Operations Dashboard

Time period: Time period selection determines how data is presented on the Overview dashboard. This update will apply to all users on this project.
Starting day of week: Starting day of the week only applies when Weekly is selected as the time period. This update will apply to all users on this project.
Set goals: If you have specific goals for First Pass Yield, Final Yield, and/or UPH you can display them along side the Project KPIs by entering them here.

