


In part 1 and part 2 of this failure analysis series, we discussed where failures come from and what tools you want to have in your toolkit to address them. Now comes the hard part: putting all those tools to work. At its core, failure analysis is about identifying what set of inputs caused an output to fail and what corrective action you want to take to fix it. So if you did all the hard work to find and identify failures, let’s dive into some steps you can take to begin your process.
Typically, you will find failures during a build or in reliability testing and only have a short time to find and fix them. When you become aware of the issue, ask yourself the following questions to organize your thoughts when performing a failure analysis:
- What is the failure mode?
- How critical is the failure?
- Is the failure repeatable?
- What is your hypothesis?
- Are there other potential factors?
- What data do you have?
- What data do you need?
- Do you have any proposed solutions?
- Do you have a way to test your solutions?
- Does your solution impact another team?
- Will there be any unintended consequences?
To illustrate a typical failure analysis, we will walk through the questions above in an example scenario.
EXAMPLE: Wearable Fitness Tracking Watch
A new wearable fitness watch is being evaluated at its EVT build. During the build a few small issues crop up but generally the devices work. However, after the build, a failure is found during drop testing. So begins the failure analysis.
What is the failure mode?
Sometimes it is easy to find a failure, but more often, you may only see symptoms of a failure and cannot be sure what the root cause actually is. In our watch example, we find that a drop test event causes the display to fail in 6 out of 10 devices tested. What we know is that something went wrong with the display after the drop event, but we don’t yet know why the failure occurred. We begin by examining what state the device is in.
- Does the failure mode present the same way on the failed devices?
- If there are different kinds of display failures then the drop event may have exposed multiple failure modes which might each have a slightly different root cause.
- Did the screen turn white?
- Are there lines out in certain rows or columns?
- Did the cover lens crack?
- Did the display crack?
- Does the rest of the device appear to be functioning? – Charging, motors, touch, etc?
- What were the specific tests that failed?
- What height was the watch dropped from?
- What substrate was the device dropped onto?
- What orientation did the failures occur?
- Are there any other obvious issues that can be observed?
- Is there any mechanical damage on the perimeter of the device?
After careful interrogation of the samples, we find that 4 of the 6 failures came from tests performed on a granite substrate and 2 came from the particle board substrate all dropped from table height of 1 meter. On 5 of the failures, the display turns white and remains unresponsive. The 6th failure, the cover lens cracked but was still showing images. On 2 of the devices, we might see some scuff marks on the cover lens, and on 3 of the devices, there are some scratches on the housing on one edge.
How critical is the failure?
Failures range in severity from low to high and many levels in between. Sometimes, what seems to be a minor issue balloons into something bigger. A typical wearable will be used and abused by its owner. Any time the user takes the watch off is a potential opportunity for a drop event. In this case, a drop failure where the display is unresponsive seems like a critical problem to solve. An unresponsive display would render the device unusable and would result in both a high return rate and unhappy customers. This problem deserves attention and should be resolved before the program moves to the next steps.
Is the failure repeatable?
Repeatability means that the same process can induce a failure consistently. For the wearable, 6 out of 10 devices failed and 5 of those 6 in the same way. This suggests that one failure was repeatable and the remaining failure was likely a one-off problem that we should monitor but not tackle at this time. Still, we need to find out if the unresponsive display problem is truly repeatable by digging into the data a little deeper.
- Does the failure occur in the same drop orientation?
- Drop test sequences are usually performed in the same way each time. It might start with the front face, then the back face, then the 4 side faces, then the corners. If the front face drop always causes the issue, it remains unclear whether the failure is due to the particular orientation of a frontal face drop or whether the problem would occur from any drop at the same height.
- To combat this, have the reliability team test more units using a different sequence or placing the failed orientation last.
- Did all the failed units have the same waterfall of reliability tests prior to the failure?
- In a good reliability test plan, environmental tests are often performed first to precondition the devices. Some will be put through heat soak or temperature cycling tests which can shock the system or weaken adhesive bonds.
- If the failure occurs on fresh units and on preconditioned ones, then the failure would appear to be a localized problem. If not, then we may need to understand what conditions the product was exposed to prior to the drop test.
What is your hypothesis?
For our watch, there might be 2 or more underlying issues. The first is that the display turns white and remains unresponsive. We might infer that the power has been cut off from the system which would point to a problem with the display itself, the display connector, or a mechanical impingement or tear on the display cable. Alternatively, the connection to the battery or power management might cause the device to fail.
Are there other potential factors?
Often challenging failures have many causes that make it difficult to clearly identify where to focus your time. If you are having trouble with your initial hypotheses during failure analysis, brainstorm a list of possible areas to investigate.
In the wearable, the EVT build is the first time we are putting something together. Often, subcomponents like the display module and other major components are manufactured with parameters that are not yet finalized. As such, the connectors, the display, or the mechanical assembly could all be contributors to the display failure.
To rule out other sources of error, we may need to sort through manufacturing process parameters, measurement data, assembly photos. We may need to dive deeper into our upstream suppliers to look for additional information. For this example, let’s assume that the display was a standard component in production for a long time which suggests that there will not be any major display changes coming and that we should focus on the mechanical design.
What data do you have for failure analysis?
In the reliability failure of the wearable, we should gather all of the available information we have access to that might help us verify our hypotheses. Since the failure occurred during a mechanical test, we should start by physically inspecting the failed units and reviewing any before and after photos and the high-speed video of the test, especially in the orientation of failure.
We are looking for any obvious deformations or breaks. If possible, we should inspect some of the failed devices and open them up to see if we can find anything wrong on the inside. The before and after photos of the units will show us if there was anything obviously wrong with the assembly prior to drop. The high-speed video allows us to observe the compression and stretch of the material that happens in faster than a blink of an eye. If the display and housing move in opposite directions after impact, there may be something worth investigating further.
Additionally, we will want to review the IQC report on the display modules and measurement FAI/Cpk reports of the major parts of the assembly including the mechanical housing. We are looking at how the actual parts compare with the dimensions and tolerances we used in our initial tolerance analyses.
If we combine these data sets, we should be able to refine our initial hypothesis and think about what data we are missing as we continue our failure analysis investigation.
What data do you need for failure analysis?
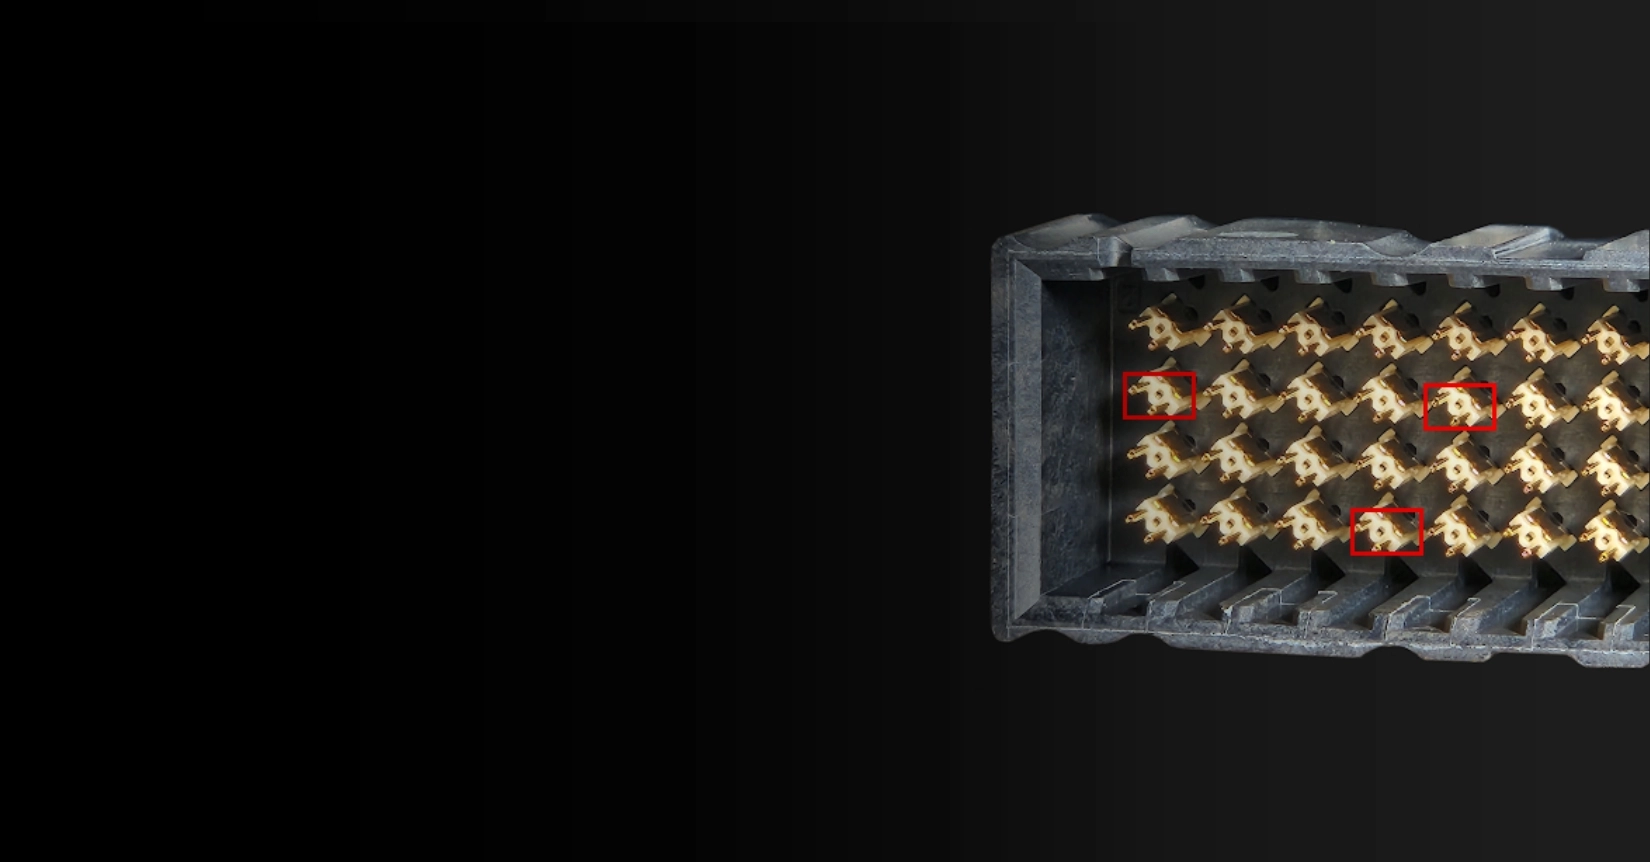
While we have physical access to the devices, we still don’t know what’s wrong until we teardown the devices. When we open 3 watches, we found that the board-to-board connectors on 2 out of 3 had come loose. The last one, we were unable to take apart properly and could not tell what the state of the connector was. But since 2 of the ones we opened showed the same problem, we will want to explore why the connector came loose.
We will want to review our simulations to focus on the forces experienced by the connector and other mating components. We should also review the connector specification for force retention and independently verify that the connectors on these displays and the main circuit board meet or exceed the specification. It’s also possible that the vendor used a low-cost version of the connector or even the wrong connector for a variety of reasons so we will want to verify the connector lot codes and part numbers.
We may need to test more devices to see if different display vendors or other configurations perform the same way.
Do you have any proposed solutions?
In our wearable, we have narrowed in on the display connector and the mechanical assembly surrounding it as an area of interest. The team spent some time analyzing the assembly and proposed a few solutions. These include:
- Adding a small piece of compressible foam over the connector to take up the air gap between the connector and the main housing.
- Using an epoxy resin to the connector once it is in place.
- Adding a metal bracket and some screws to securely fix the connector in place.
- Changing the connector on the display FPC and the board.
Each of these solutions has its pros and cons and would require additional work to test. We can eliminate option 4 after the operations team tells us the display is a standard component and the costs and lead times would increase significantly if we moved to a new connector.
The mechanical solutions require design and assembly changes that may also have potential downstream effects on the mechanical and electrical performance as well.
With the foam solution, we should review the size of the gap in the nominal condition as well as in the drop test condition to select an appropriate material. If the foam will also be pressing on the underside of the display, we should make sure it doesn’t push too hard from behind to distort the screen.
The epoxy solution could be a quick fix, but it could open a can of worms about the process configurations and material choices. Additionally, once a component has been epoxied it is nearly impossible to rework meaning that once this step is performed on the assembly line, if something subsequently goes wrong, this whole assembly may need to be thrown out.
With the metal bracket, we would need to find the space to attach the bracket and make sure there are no shorting concerns. If we attach it with screws, the display routing will become more difficult as there are likely a lot of traces in the way.
Do you have a way to test your solutions?
Two of the solutions may be easy to prototype – the foam and the epoxy. However, both come with some risks, especially after the build has been completed. We would need to disassemble some devices to add the foam or epoxy. During disassembly, there is always the chance that we could introduce another issue more related to the uncontrolled assembly process than the option we are trying to investigate. However, if the prototypes show promise, this would be a quick way to gain confidence in a solution.
The metal bracket could be simulated in CAD or approximated with some machined parts but would be difficult to functionally retrofit in the existing housing. Because the board would need to be modified to accommodate the screw bosses and the board itself would need holes drilled through it, it is unlikely that a functioning prototype could be made prior to the next build. So instead, we could rely on the combination of a mechanical mockup and simulations to approximate how the design change would perform.
Does your solution impact another team?
All of the fixes for the wearable impact other teams. The least disruptive for others would likely be adding foam behind the connector. This is an easy option to test and requires only minimal changes or evaluation by other teams. At the same time, it is unclear if the foam will be enough to prevent the connector from popping loose. Also, if the foam exerts too much force on the display, it could work against us by serving as a pressure point on the display during a drop event or hurt us by pushing up on the display and exposing the edges of the cover lens to spider cracks.
The epoxy solution would require investment in the assembly process to ensure the epoxy can be dispensed properly. Liquid glue processes are notoriously difficult to finalize so while it may be worth prototyping, we might hope not to use this option. Also, there would be a hit to the cost of the product since yield loss will likely be higher, and rework will be more difficult.
The sheet metal bracket will take the most time to implement and require the electrical teams to layout the board traces again. Additionally, we would need to evaluate whether the metal shield would cause any unintentional radiation or interfere with wireless signals in the product.
Will there be any unintended consequences?
When making design changes to fix a problem, it is easy to get caught up in the problem you are trying to solve and you may forget to evaluate the design for what else could go wrong. In this example, it is possible that putting holes in the printed circuit board and bolting a bracket over the connector will make this area of the board weak and instead of the connector popping loose during a drop test, the board itself could break causing a bigger failure than the one we intended to solve.
Review of this failure analysis example:
Through the process of reviewing the available data, creating hypotheses, and testing, we have found the potential root cause of the issue. We suspect the connector experienced more force than it was rated for and due to the designed air gap between the top of the connector and the housing, would come loose during the drop event when the air gap temporarily became larger. To fix this issue, we have identified 3 possible solutions to test and implement. Which way we choose to go next depends on how well the solutions work and how they potentially impact the schedule and project costs.
Monitoring Corrective Actions
Once a course of action has been chosen, the team would not only need to go through the process of making the design changes but would need to develop a plan for implementing and monitoring the solutions at the next build.
To preserve optionality, the team could decide to move forward with the design change to add the bracket and also prepare the foam. This would incur the small schedule hit required of a tool change and layout work for the electrical team, but would provide the optionality of testing out multiple solutions during the build hopefully capping the number of extra EVT builds to just one.
Knowing that there is a major vulnerability to test, the team can arrange the build to prioritize data gathering for this issue. This build might include configurations of just foam, just the metal bracket, and one that includes the foam and bracket together.
Prior to the build, the team could perform a new FMEA and predict where potential problems might arise from the new designs. Using the FMEA as a starting point, the team could arrange for more checking steps at the critical transforms where the changes are implemented. Engineers on-site should also be encouraged to pay careful attention to the build at these steps.
For example, the team should observe how difficult it is to assemble the new bracket. This design change might require new or updated jigs to place the part properly without damaging nearby components. Additionally, the sharp edges of the bracket itself could cause damage to the flex cable during assembly or reliability testing so we should check the functional test station results early for any signs of yield fallout.
Finally, we should arrange for the first batch of devices from the new build to be allocated for reliability testing. We can work with the reliability team to determine how many units would need to be tested and pass to feel confident in our solution. While the build is ongoing, we could get a clearer picture of whether one or more of the configurations resolves the issue while making sure that no new issues crop up.
Conclusion
The wearable example shows that even in relatively straightforward issues, there are many things to consider during failure analysis. Reliability reports, physical devices, build data, and even data from upstream vendors all help to fill in the gaps as we try to understand what went wrong and how to fix it.
In real programs, engineers will face many different issues and have to solve them all in parallel. Often, there is little time to perform deep dive analyses on all issues before the next build. Therefore, it is important to eliminate small problems quickly so they can focus on the critical challenges with a given architecture. Any tools that can help engineers collect and connect disparate data sets are immensely helpful for identifying potential root causes and working through more issues in the same amount of time. Once a solution has been found, it will be scrutinized on cost, speed, and ease of implementation and everyone will have a different opinion on what the best course of action will be. Even after the root cause has been found and a solution is proposed, this just sets up a new baseline from which failures can occur. The real test will be at the next build because you could be introducing a host of unintended consequences. This process repeats until you run out of time or in an ideal world, you solve all the problems.
Instrumental has created a unique set of tools to reduce the friction involved with every step of failure analysis. By collecting product data and running images through artificial intelligence, we can find possible anomalies before it is too late to stop them. We can also store and track important data in our Manufacturing Optimization Platform adding correlations between failed test data and product assembly information. Not only are we reducing the time and effort spent on small failures, but we are collecting and transforming data to solve the big issues to ultimately make products better. Contact us to learn more about how we can help you improve your failure analysis process.
Author
Related Topics